Sigma Online User Manual
Best Available Consumption Data Overview
- Kim Blake
- Tom Anderton
- Graham Paul
- Wendy Sagar
Introduction
Reports in Energy Intelligence use Views, which are based on various core Data Sources such as Billed Consumption, Metered Consumption, Bills and Charges and Best Available Consumption.
The Best Available Consumption View weaves together the different sources of data to ensure the reports are ready when you need them - estimating missing data and forecasting to the current date where required. Therefore, the view uses more than one source of data to build a Report, and can use Actual, Estimated and System Generated Data, based on your own database preferences.
The Best Available Consumption View also includes any data in the Consumption Data Channels. These Channels are usually created at Site Group or Site level and contain Consumption or Emission Data.
More information on Consumption Data Channels and Greenhouse Gas Reporting can be found here:
- Greenhouse Gas Reporting (GHG)
- Creating Commodities
- Creating Data Consumption Channels
- Entering Data Consumption Values manually
Sigma can manage several different data sources that represent your energy usage, this will usually be in the form of:
- Supplier Bills – the invoices received from a utility supplier
- Metering Data - the consumption data received for the meters (this may be Periodic data such as readings from every half hour, or Non-Periodic such as cumulative meter readings each month)
- Supplier Statements – summary data received from your energy Supplier (usually annually)
It is likely that there are multiple sources of data available for the same utility supply which may cover the same or different periods of time. The Best Available Data view facilitates being able to provide the best picture for this usage and therefore resultant emissions based, without any need for complex data manipulation or user intervention. These different sourced of data are linked together via the Supply Point.
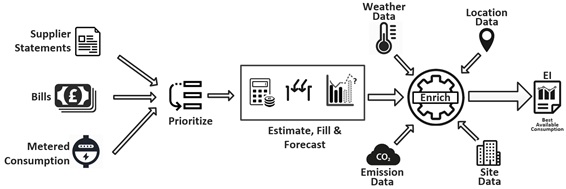
Infographic of the best available data concept.
Summary
- Different sources of consumption data can be stitched together to provide the best available picture for a date range (from Meters, Bills, Supplier statements and Consumption Data Channels)
- Data is sourced, prioritised, and estimated according to flexible configuration (see below for more details)
- Data is converted to a common unit of measurement for reporting, per commodity, i.e. kWh for Gas and Electricity and m3 for Water
- Missing data is filled using configurable estimation techniques to facilitate accurate and complete reporting
- Data can be forecasted from the current date to ensure outputs are up-to-date
- Data can be enriched with Emissions, Associated data and Degree Days data
Supply Points
Supply Points are key to the Best Available Data View as it is based on the Supply Point, and the Items within it.
A Supply Point typically contains:
- Metering - New meters and old Meters (as Meters are replaced over time)
- Contracts – The Contract that for providing that service over time
- Account – The Bills loaded to an Account for your Energy use
- Supplier Statements – Annual statement figures loaded into the Supply Point (figures submitted from the Supplier to give a breakdown of the annual consumption) (Optional)
Note: If you want to use Reports from the Best Available Data View, you will need Supply Points with the following: If you do not have any of the Items set up, click here for details on how to: Or if you have partially set up the Items:
For any Supply Point/Day of Data, you will also be able to view:
- What Data Type was selected
- What Priority it was
- What Configuration Level was applied (Global or Supply)
- If it was System Estimated
- What Estimation Level was applied.
Using the relationships driven by the Supply Point, and the best available preferences which have been set, Energy Intelligence will determine the best piece of data to use for each date within the requested reporting period, estimate for missing or overdue data where appropriate. This concept is known as “Best Available Data”.
The following diagram illustrates how this Supply Point configuration is represented over time in Sigma and how the different streams of data are linked together to represent the same usage.
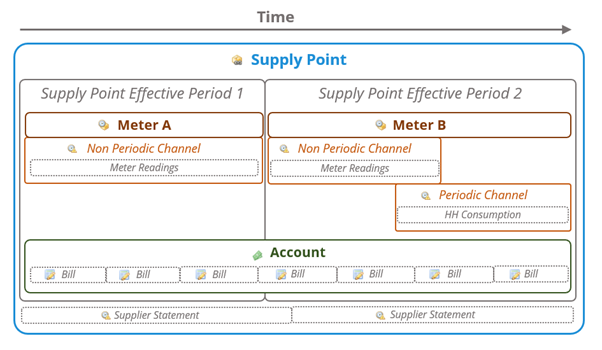
Infographic of the supply points effective relationships.
Data Enrichment
Once Energy Intelligence has determined your “Best Available Data” according to the preferences set (see above), it can enrich it with the following additional information to enable you to analyse and report according to what is important to you.
- Associated Data - Floor Area, Population and Occupancy values (taken from the Site associated with the Supply Point), plus the normalised consumption daily total for each
- Emissions - Co2, Co2e, Ch4 and N2o emission factors, plus the factors pre applied against consumption daily total
The following Data Model illustrates what information you will be able to pull into reports and dashboards from the new “Best Available Data” view in EI:
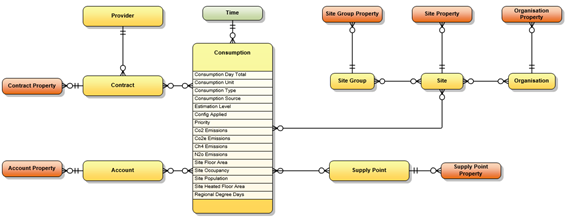
Best Available View - Data Model
There are several core Reports and Dashboards with this functionality to highlight your environmental impact and be able to showcase this within and outside your Organisation.
Accessing the Global Configuration
- Access will depend on the Role of the User
- Click here for more information:
Data Sources Configuration
The rules Sigma uses to build up the best available data picture for each Supply Point is fully configurable. Sigma provides the ability for Users to set the rules which govern how it builds up this best available picture for each supply. These rules can be set at the system level to apply to everything and over-ridden at an individual Supply Point level if different rules should be used for specific supplies (instead of the default).
Click here for help on configuration your database: Best Available Data Configuration
Firstly, the Data Source Priority is the order of precedence that should be used when the data is sourced (where data exists for multiple sources for the same period). The options available are:
- Periodic Channels – Actual*
- Periodic Channels – Estimated*
- Non-Periodic Channels – Actual*
- Non-Periodic Channels – Estimated*
- Supplier Bills – Actual
- Supplier Bills - Estimated
- Supplier Statements – Actual
- Supplier Statements - Estimated
The above options can be set into a priority order to suit your reporting needs. For example, if the above reflected the priority order (top to bottom), it would first try and source actual periodic data, and if that was not available for a day, it would then try and find estimated periodic data, then actual non-periodic data and so on.
Secondly, if no data is available for any of the sources, there is also the option to configure if and how estimation should be applied to “fill” in the gaps, ensuring a complete picture for reporting purposes.
By default, no estimation will be performed – this configuration must be enabled for it to take effect.
Data Estimation Configuration
It is important to have an accurate and complete picture of this data that you can trust.
Sigma provides a way to have that trusted view without any complex or manual data manipulation and exposes it as “Best Available Data” through Energy Intelligence.
Sigma gives you full control over how “Best Available Data” is determined, covering:
- Data Types - Specify which data (Actual or Estimated) should be sourced from Supplier Statements, Bills, and/or different meter types. This is all driven from Supply Points
- Data Priorities - Specify which priority to give each type of data, so the system can choose which data prevails when multiples are found covering the same period
- Data Estimation - Specify what level of estimation you want Sigma to perform to fill missing data
Sigma also enables you to specify all the above configuration at both a Global level and for individual Supply Points, giving you full flexibility in deciding how best to determine the right data across your Energy Estate.
Estimation Techniques Configuration
Sigma offers a tiered estimation solution which allows you to configure how it should attempt to fill in missing periods. You set the tier limit as per how far you are prepared for the system to attempt any type of estimation, rather than reporting that there is “missing data”. The principle behind the estimation techniques is equivalent days mapping (or direct comparison) which is to determine averages from historical representative data points and use them to fill missing periods.
- Tier 0 – No estimation is performed to fill missing data
- Tier 1 – the estimate will be based on the average for the same day of the week and month from the prior year of data
- Tier 2 - the estimate will be based on the average for the same day of the week and month from the last 5 years of data
- Tier 3 – the estimate will be based on the average data from the same day of the week (for all available days in the last 5 years)
As per the data source prioritisation, this estimation configuration can also be set at the system level for everything, or over-ridden at an individual Supply Point level if different estimation techniques should be used for specific supplies.
The system will always try and use the highest tier of estimation where possible, for example, if tier 3 estimation is configured, the system will first attempt Tiers 1 then 2 first before falling back to 3 if it needs to. If Tier 3 is applied then as long as there is consumption covering at least each day of the week requiring estimation, it will be able to produce an estimate. However, if that was the case, the system will not have been able to build in any seasonal variation in your data set, this is what the higher tiers will be able to do, which is why they are attempted first. Sigma will ensure that the data is as complete as possible by estimating forward from the latest data point to the current date if estimation is enabled. This forecast helps ensure you can run realistic reporting where there may be a delay in getting recent data into the system, for example, due to delays in receiving data or infrequent data load schedules; allowing you to provide a view of the consumption and emissions up to and including today. This data is available in Energy Intelligence and not stored against the assets (Channels / Accounts) in Sigma. Forecasting Consumption and Emissions Data
- Click here for more information on Forecasting Consumption and Emissions Data
Example Dashboard (collection of Reports)
Reporting Period
You can report up to 5 years of data in EI, and the applicable periods in which your Supply Points Data cover is defined from the first date you have Consumption Data loaded for (from any source), up until either the last contract container date, Site closed date or the current date, whichever is earlier.
Emissions Dashboard
There is a Dashboard (collection of Reports) in Energy Intelligence that uses the Best Available Consumption Data View.
The results will depend on the settings you have configured in your database.
You can amend the default settings, Globally, or at an individual Supply Point level. Click here for more information: Best Available Consumption Configuration.
To view the Dashboard:
- Open Energy Intelligence
- Search 'Emissions Summary'
- Right click on the Report
- Click Open
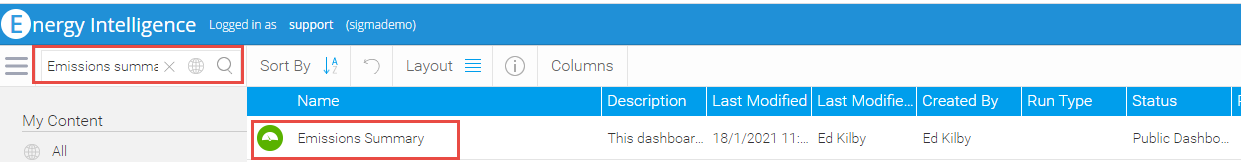
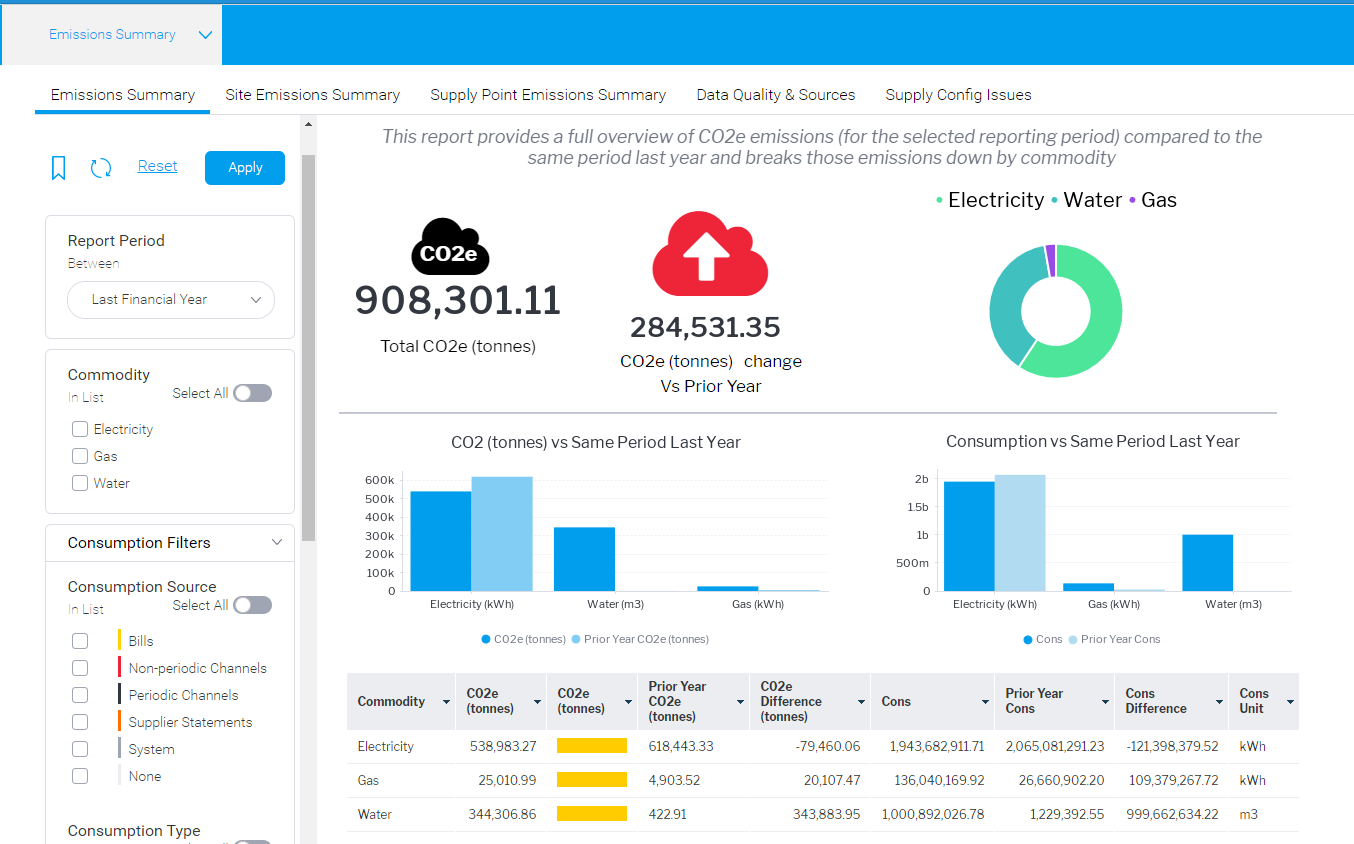
The Emissions Overview Dashboard appears:
Changing the Default Configuration
Click here for more details on how to view and change the settings: Best Available Consumption Configuration
Related content
@ Copyright TEAM - Energy Auditing Agency Limited Registered Number 1916768 Website: www.teamenergy.com Telephone: +44 (0)1908 690018