/
Creating Reports in EI
Sigma Online User Manual
Creating Reports in EI
- Graham Paul
- Kim Blake
Owned by Graham Paul
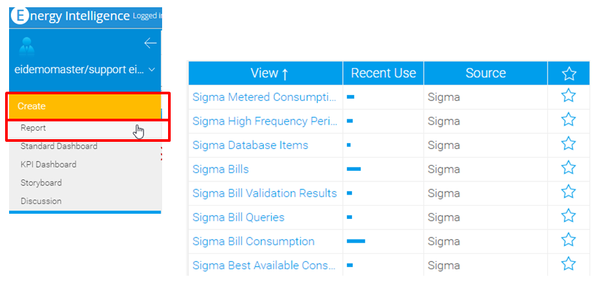
Creating the Report:
- Create >
- Report >
- Choose Metered Consumption View
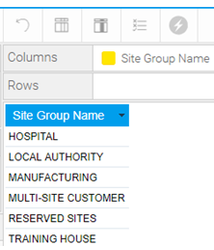
Data Tab
Drag and Drop to the canvas:
- Site Group Name
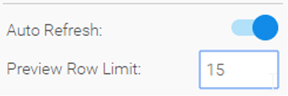
Preview:
- Set Preview Row Limit to 15
- Click Refresh Report
Drag and Drop to the canvas:
- Site Name
- Cons Day Total
- Cons Date

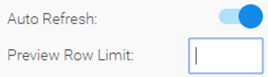
Reset Preview:
- Delete 15 from the Preview Row Limit
- Click Refresh Report
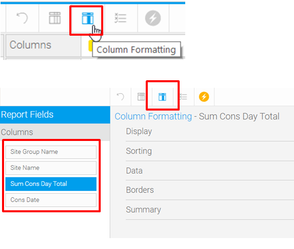
Format Columns:
- Click on Column Formatting
- Format as required
Filtering:
- Choose various Items to filter on
- Drag and drop the Item to the Filters field
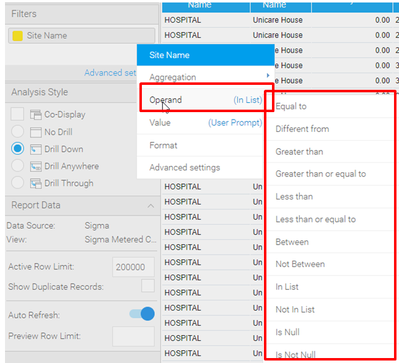
Operand:
- Choose the way you want to filter, such as including in list, greater than, between etc
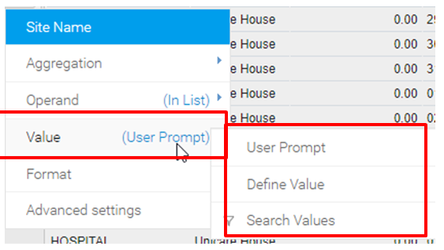
Value:
- User Prompt – allows you to filter each time you run the report
- Define Value –This is a permanent filter. For example, enter the name of the Site you wish to always exclude from your report
- Search Values – allows you to choose from a list of Items you wish to exclude. For example, tick all the sites you want to include or exclude permanently from the report
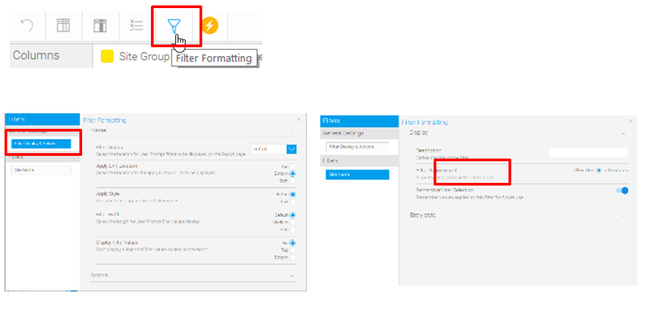
Filter Formatting:
- Click on Filter Formatting
- Choose General Settings for actions such as the format and actions
- Choose the Site Name to choose whether the Filter is Mandatory etc
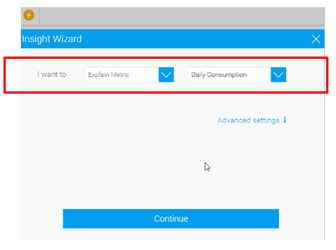
Use Smart Analysis:
- Click Smart Analysis >
- Choose Daily Consumption
- Click Continue
- Pop appears on the right hand side with the suggested analysis
- Tick those that you want to use in your report
, multiple selections available,
Related content
Reporting - Energy Intelligence
Reporting - Energy Intelligence
Read with this
Adding and Configuring Filters in EI
Adding and Configuring Filters in EI
More like this
Example Dashboards in EI
Example Dashboards in EI
Read with this
EI Dashboards - Site Analysis Dashboard
EI Dashboards - Site Analysis Dashboard
More like this
Meters - Daily Consumption EI Reports
Meters - Daily Consumption EI Reports
More like this
EI Drill Down - Drill Anywhere
EI Drill Down - Drill Anywhere
More like this
@ Copyright TEAM - Energy Auditing Agency Limited Registered Number 1916768 Website: www.teamenergy.com Telephone: +44 (0)1908 690018