Sigma Online User Manual
Introducing Data Monitoring
- Kim Blake
- Tom Anderton
- Graham Paul
Accessing Data Monitoring
The Data Monitoring Activity was first introduced in Version 12.8, in July 2019 and subsequently enhanced in Version 12.9 in September 2019. This feature allows you to:
- Create Monitoring Strategies that control whether/how the system searches for the following data issues in periodic channels:
- Data Gaps
- Overdue Data
- Unexpected Data
- Suspect Data (Dynamic Profile) - to check current data against a typical historical profile
- Suspect Data (Fixed Profile) - to check current data against a user defined profile
- Configure Monitoring Strategies to automatically fill Overdue Data and Data Gaps
- Assign Channels to Monitoring Strategies either on a case by cases basis or by specifying the parameters of the channels that should be included
- Search for and work with problems in data, using visualisation tools to help analyse the problem
- Review and work Notifications that are raised - individually or in bulk
The Activity can be accessed in the same way as all other Activities - from the Welcome Page, from the Activity Launcher or from the Activities dropdown list.
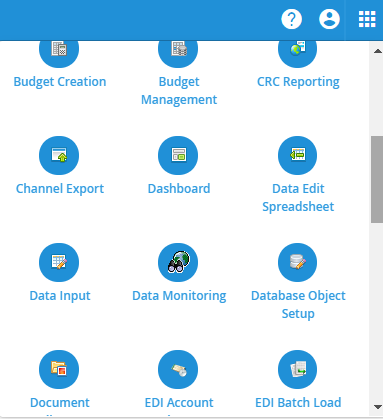
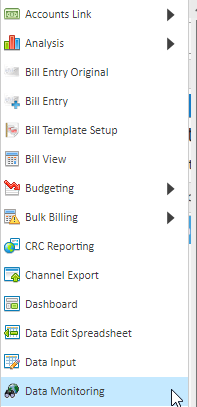
Any options will take you to the Data Monitoring Activity.
If you can't see the Activity, it is possible that the role linked to your login does not have sufficient access rights.
Your system Administrator will need to ensure the Activity is enabled for the applicable user role. Please see more information here.
You can also access Data Monitoring information in the context of an individual Periodic HFD Channel Item Editor. Click here for more information.
Data Monitoring Checks
There are three data anomalies Sigma will look for:
- Data Gaps - where there are gaps in the interval meter read data that has been received
- Overdue Data - where data is due based on how often it is expected to be loaded, but has not been received; or where data is missing for all time
- Unexpected Data - where data has been received but was not expected (e.g. where a site or meter has been marked as closed)
Trend Analysis
There are two types of Trends Sigma will look for:
- Dynamic Profile - this supports general analysis to determine where recent behaviour has gone out of trend with the equivalent previous behaviour in recent periods of time. Recent data is compared with averaged data from a preceding period for the equivalent intervals of time. Where the recent data falls outside a specified tolerance, an exception will be raised
- Fixed Profile - this supports more sensitive analysis to compare recent data against defined thresholds which have been specified at the required interval. Where the data falls outside of these high or low thresholds, then an exception will be raised.
You can define your own monitoring strategies within the framework. These control whether and how the system searches for data gaps, overdue data, unexpected data and suspect data in periodic channels. Notifications will be raised for review – these will tell you the potential impact and can then be progressed using intuitive workflow, including the ability to capture notes to keep on track of your investigative action.
When reviewing notifications and using the resolution tools, the missing, unexpected or suspect data will be clearly highlighted in red. Then, when resolving the issues, a preview feature is also available for you to be able to see what the resolved data will look like (highlighted in green) before it is confirmed.
To help you even further and fully automate the process, the data gap and overdue data strategy types can be configured to automatically extrapolate overdue data and fill intermittent data gaps using historical data profiles (samples) of your choosing; equivalent data from the past four to six weeks, for example.
Working with the Data Monitoring Activity
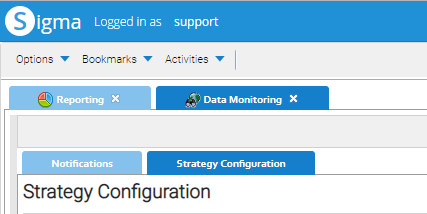
The Data Monitoring Activity is split into two key features, which are represented by sub-tabs within the activity.
- Creating Data Monitoring Strategies - this is where the data monitoring checks can be set up and configured, including specifying the periodic channels that they should be run against.
- Notifications - this is where the problems that are raised as a result of the checks can be viewed, progressed and resolved.
Automatically Running Monitoring Strategies
Sigma will check for problems and re-assess existing Notifications each night.
Sigma will identify each Monitoring Strategy that is configured with a status of 'On'. For each Monitoring Strategy identified the system will identify the channel(s) associated to the strategy and perform the required checks over the channel data according to the configuration that has been set. All raised problems will be visible in the Notifications tab.
The system will also be intelligent and re-assess whether the Open Notifications are still valid (e.g. the data is now present for a Data Gap Notification). These will be automatically closed by the system, but will still be visible in the Notifications sub-tab for audit purposes.
Manually Running Monitoring Strategies
You do not need to manually run a Strategy, unless you want to see the up to date notification straight away. As above, the Strategies run overnight, but click here for details on how to manually run a Strategy.
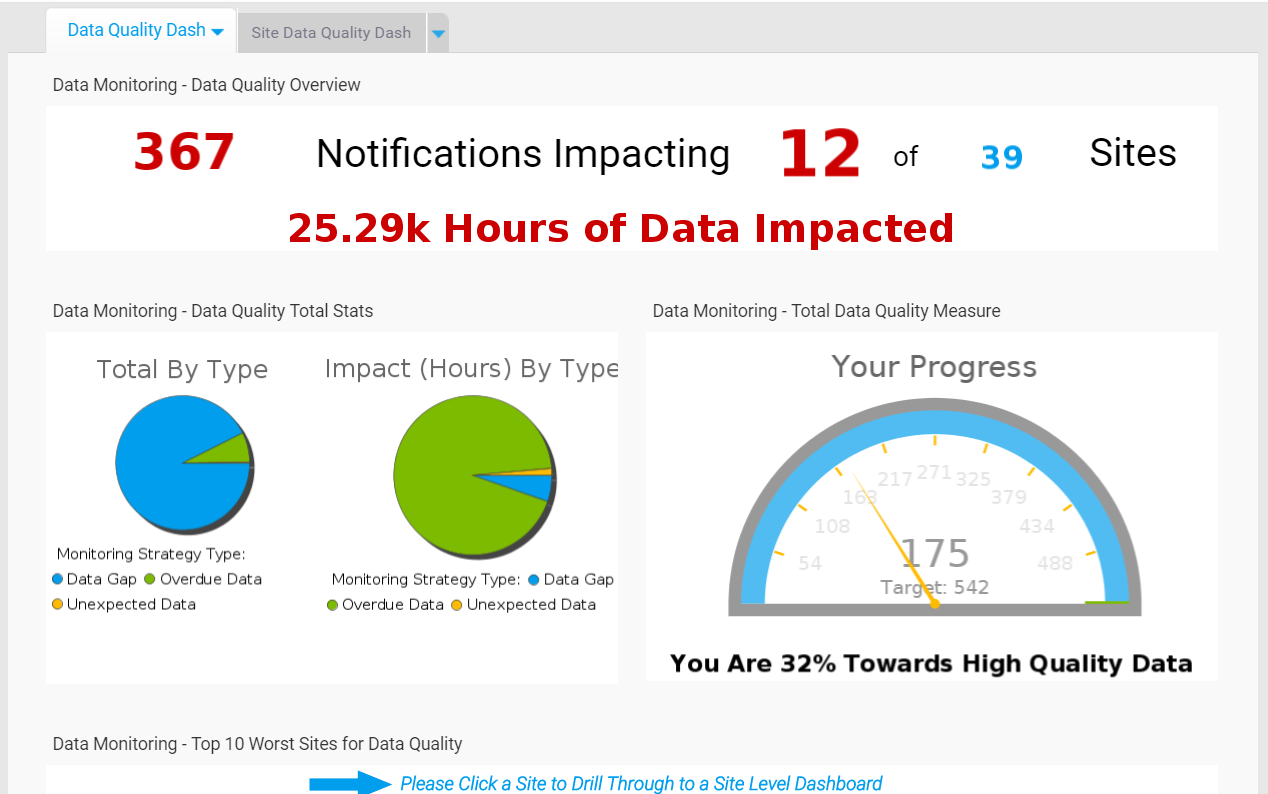
Data Quality Dashboard
Energy Intelligence has a dashboard to help summarise your Notifications and data quality. It contains a number of different reports showing the following:
- An overview of the notifications, including the amount outstanding and how many sites are affected
- Total hours impacted
- Your progress - what percentage you are at towards high quality data
- Top 10 impacted sites (by hours)
- Progress on resolving notifications
- Past 6 months affected by poor quality data
The Top 10 impacted sites reports has a drill down feature which shows you the particular site, and contains the following reports:
- Site details (Name, Contact, Email etc)
- Details of the individual Channels affected
- Your progress - what percentage you are at towards high quality data (for this site)
- Total impacted hours
- Past 6 months affected by poor quality data
The Details of the individual Channels affected Report also has a drill down feature which shows you the 'consumption drill down' pop up. This shows:
- A heat map for the individual Channel
- Channel consumption profile
- Total consumption by half hour
- Consumption by day of the week
Click here to open the Data Quality Dashboard in your database.
Alternatively:
- Open Energy Intelligence:
- Click on the menu
- Click Browse
- Click Dashboards
- Click Data Quality Dashboard to open the Dashboard
@ Copyright TEAM - Energy Auditing Agency Limited Registered Number 1916768 Website: www.teamenergy.com Telephone: +44 (0)1908 690018