Sigma Online User Manual
Meters - High Frequency Consumption (Half Hourly) EI Reports
- Kim Blake
- Wendy Sagar
This page shows Reports that use the Meters - High Frequency Consumption View. The first column has a link that will open the Report in Energy Intelligence.
Click on the link in the table to take you directly into the Report in Energy Intelligence in your own database.
Report Link - click on the link to log into Sigma and view the Report | Thumbnails | Report Description |
| Billed Consumption Vs HH Consumption by Account | 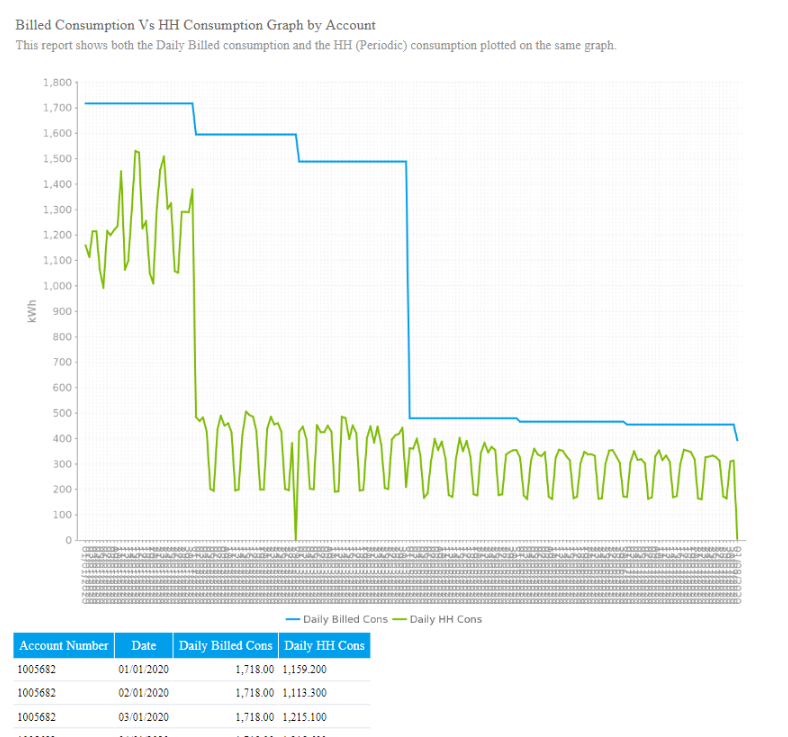 | Billed Consumption Vs HH Consumption by AccountShows both the Daily Billed consumption AND the HH (Periodic) consumption plotted on the same graph. |
| Billed Vs HH Cons Graph |
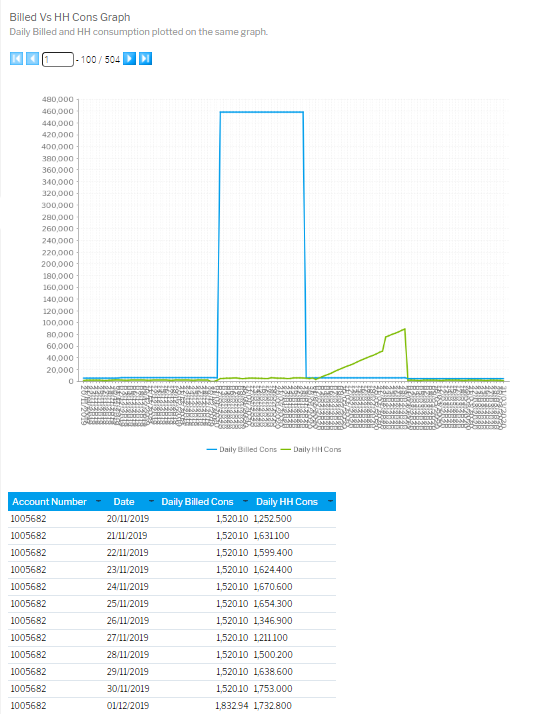
| Billed Vs HH Cons GraphDaily Billed and HH consumption plotted on the same graph. |
| Daily Energy Summary (Drill Through) |
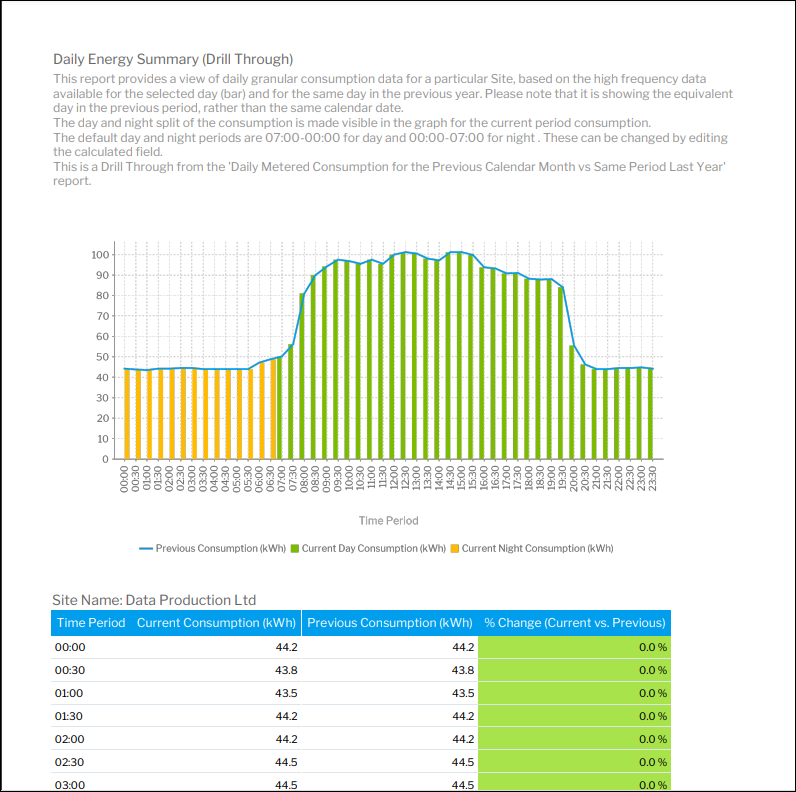
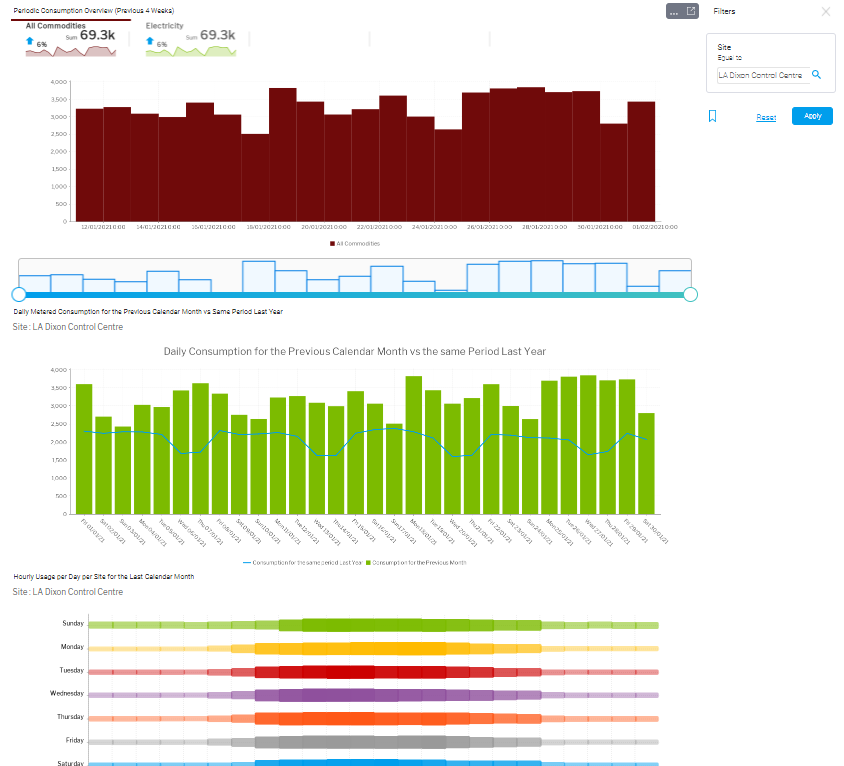
| Daily Energy Summary (Drill Through)This report provides a view of daily granular consumption data for a particular Site, based on the high frequency data available for the selected day (bar) and for the same day in the previous year. Please note that it is showing the equivalent day in the previous period, rather than the same calendar date. The day and night split of the consumption is made visible in the graph for the current period consumption. The default day and night periods are 07:00-00:00 for day and 00:00-07:00 for night . These can be changed by editing the calculated field. This is a Drill Through from the 'Daily Metered Consumption for the Previous Calendar Month vs Same Period Last Year' report. |
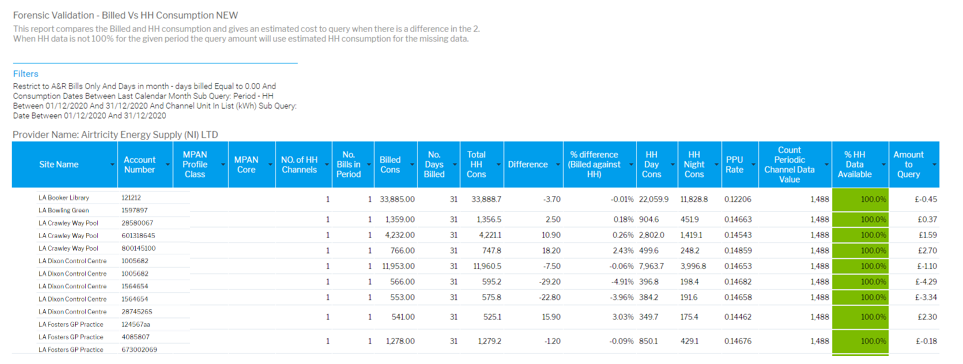
| Forensic Validation - Billed Vs HH ConsumptionThis report compares the Billed and HH consumption and gives an estimated cost to query when there is a difference in the 2. | |
| Gaps in HF Data (daily, within last 14 months) |
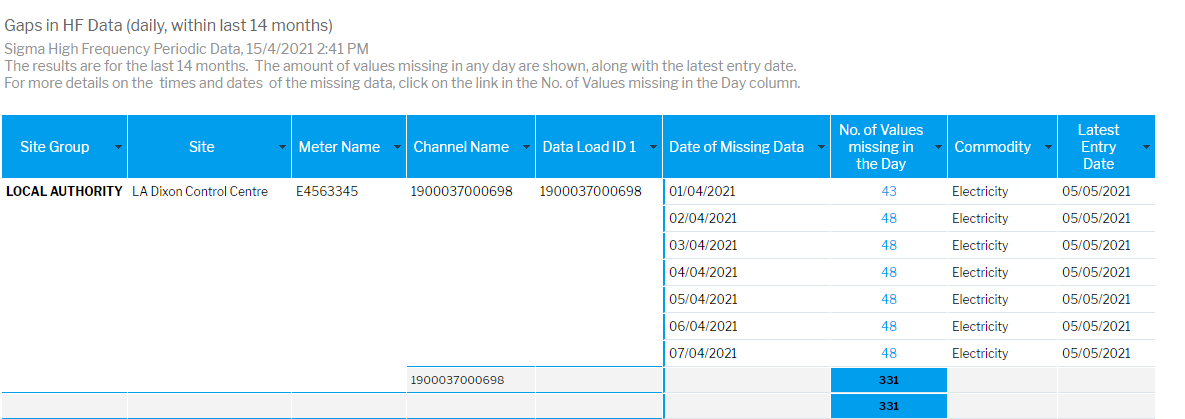
| Gaps in HF Data (daily, within last 14 months)The results are for the last 14 months. The amount of values missing in any day are shown, along with the latest entry date. For more details on the times and dates of the missing data, click on the link in the No. of Values missing in the Day column to see a graph and tabular data for each day. (Links to Periodic Consumption Values) |
| HH Channel Daily Comparison |
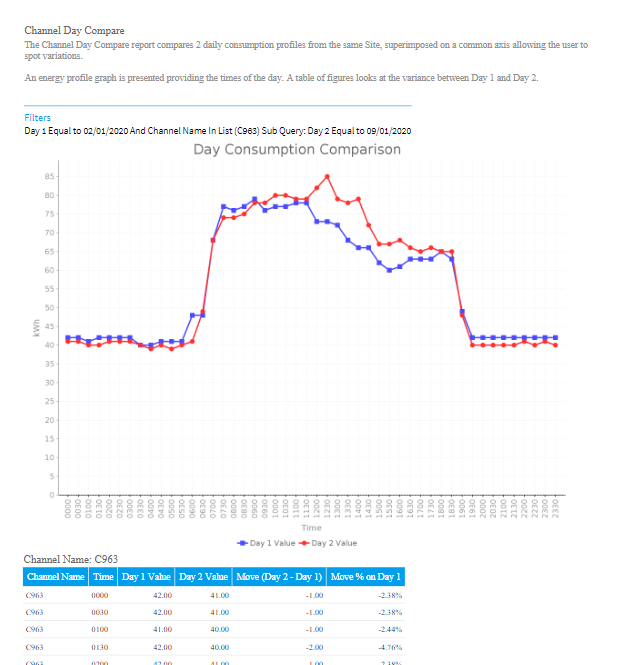
| HH Channel Daily ComparisonCompares 2 daily consumption profiles from the same HH Channel, superimposed on a common axis allowing the user to spot variations. |
| HH Metered Consumption Charts |
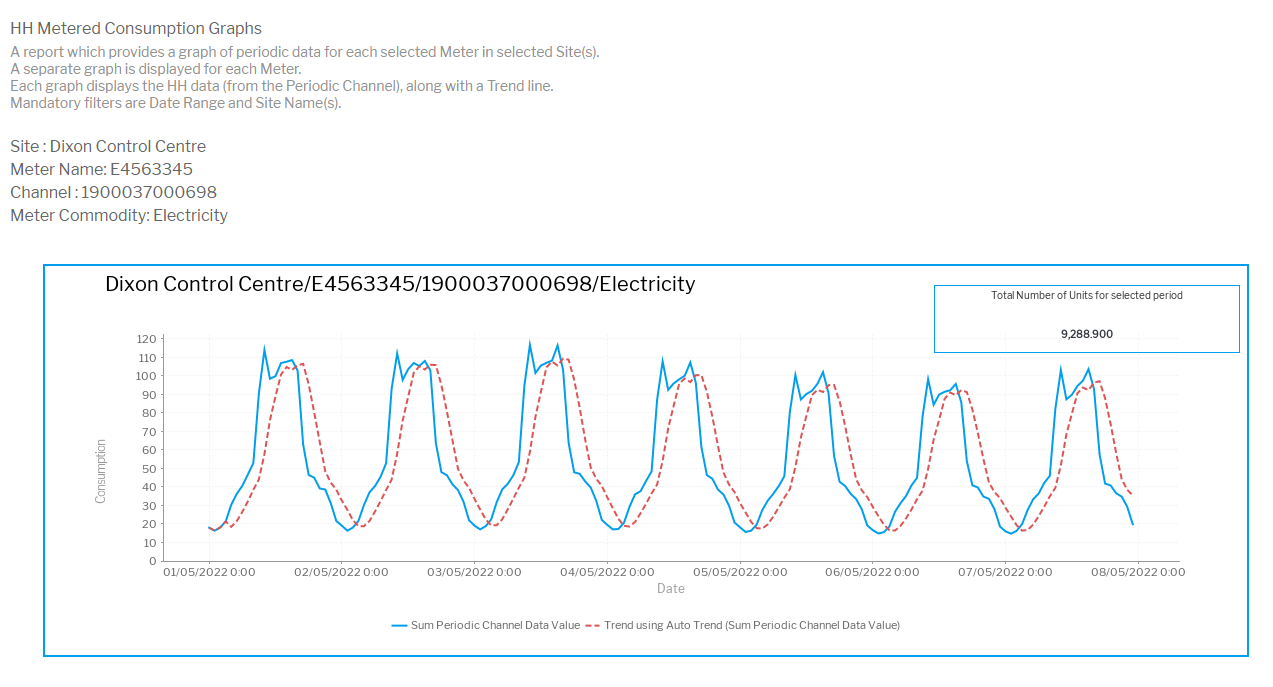
| HH Metered Consumption Charts A report which provides a graph of periodic data for each selected Meter in selected Site(s). A separate graph is displayed for each Meter. Each graph displays the HH data (from the Periodic Channel), along with a Trend line. Mandatory filters are Date Range and Site Name(s) . |
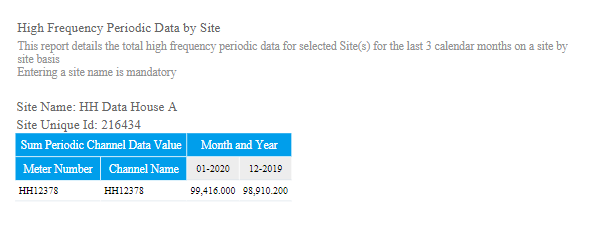
| High Frequency Periodic Data by Site (Last 3 Calendar Months) |
| High Frequency Periodic Data by Site (Last 3 Calendar Months)Details the total high frequency periodic data for selected Site(s) for the last 3 calendar months on a site by site basis |
| Hourly Usage Per Meter | 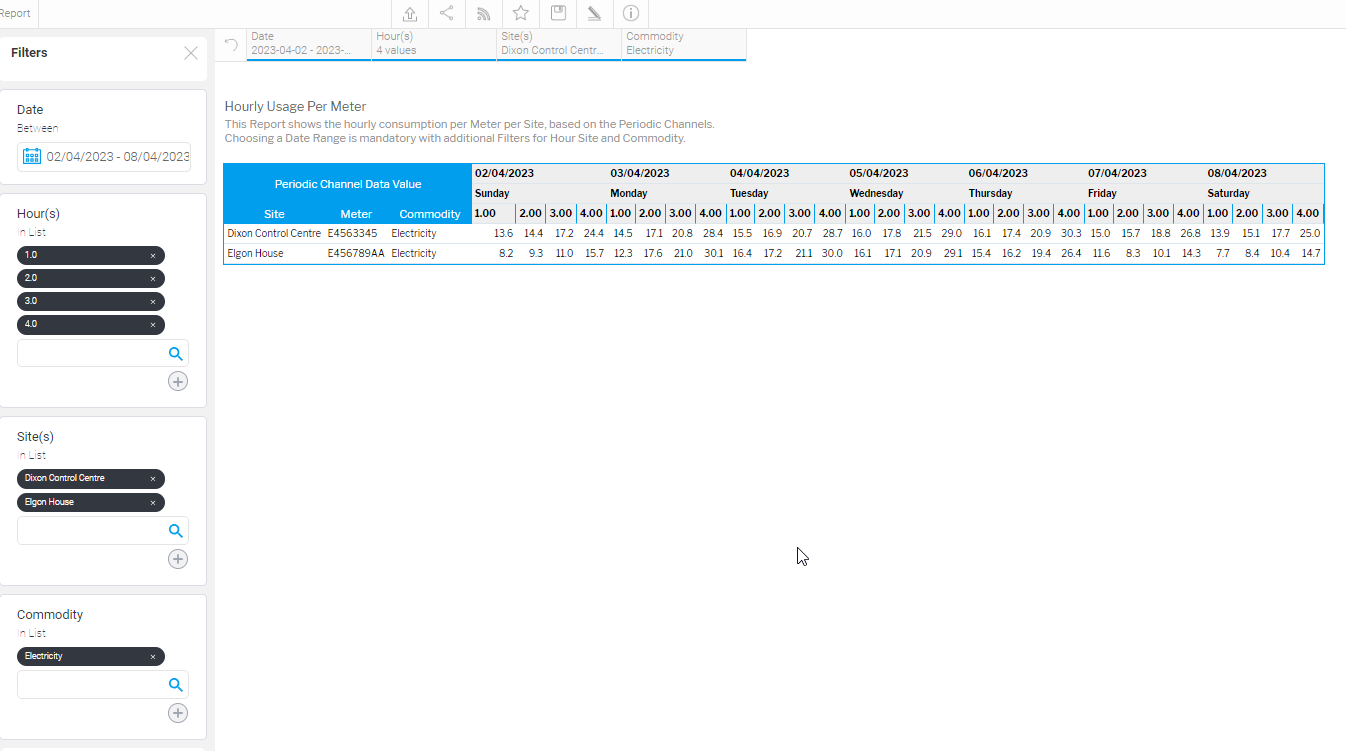 | Hourly Usage Per MeterThis Report shows the hourly consumption per Meter per Site, based on the Periodic Channels. Choosing a Date Range is mandatory with additional Filters for Hour Site and Commodity. |
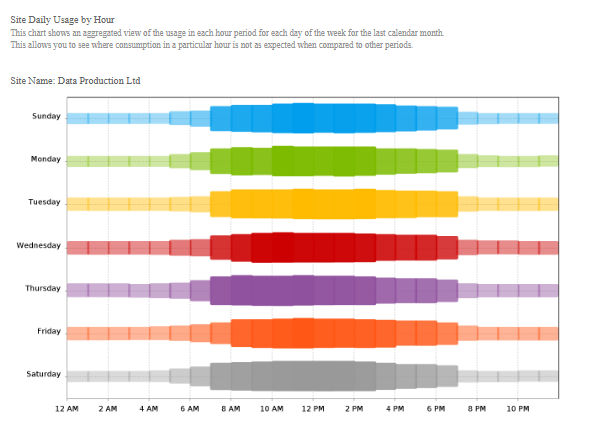
| Hourly Usage per Day per Site for the Last Calendar Month |
| Hourly Usage per Day per Site for the Last Calendar MonthShows an aggregated view of the usage in each hour period for each day of the week for the last calendar month. |
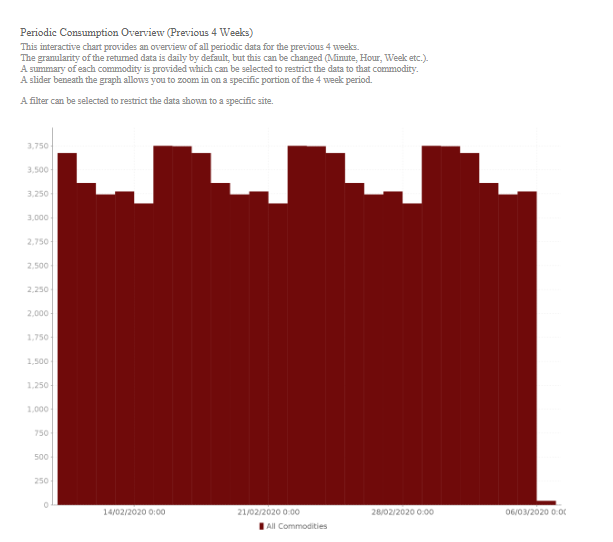
| Periodic Consumption Overview (Previous 4 Weeks) |
| Periodic Consumption Overview (Previous 4 Weeks)This interactive chart provides an overview of all periodic data for the previous 4 weeks. |
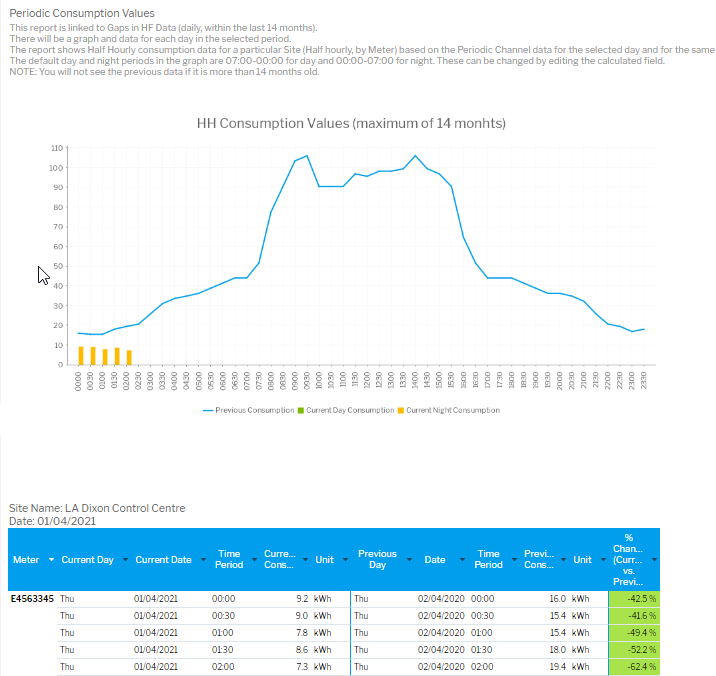
| Periodic Consumption Values |
| Periodic Consumption ValuesThis report is linked to Gaps in HF Data (daily, within the last 14 months). There will be a graph and data for each day in the selected period. The report shows Half Hourly consumption data for a particular Site (Half hourly, by Meter) based on the Periodic Channel data for the selected day and for the same day in the previous year. Note, it is showing the equivalent day in the previous period, rather than the same calendar date. The default day and night periods in the graph are 07:00-00:00 for day and 00:00-07:00 for night. These can be changed by editing the calculated field. NOTE: You will not see the previous data if it is more than 14 months old. |
| Site Analysis Dashboard |
| Site AnalysisProvides a series of reports to help you to explore the granular data that is being collected for the meters on your sites. *Search for the Site Analysis Dashboard in Energy Intelligence. |
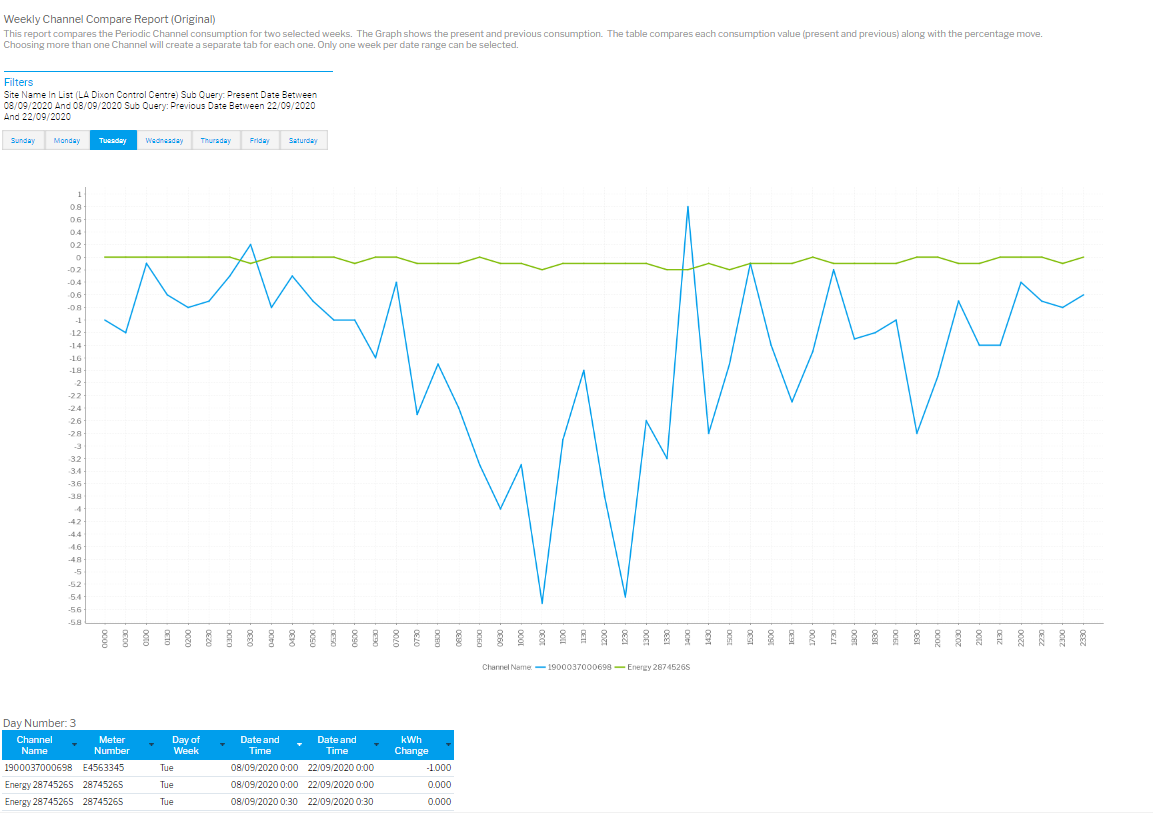
| Weekly Channel Compare Report (Original)Compares the Periodic Channel consumption for two selected weeks. The Graph shows the present and previous consumption. The table compares each consumption value (present and previous) along with the percentage move. Choosing more than one Channel will create a separate tab for each one. Only one week per date range can be selected. |
Related content
@ Copyright TEAM - Energy Auditing Agency Limited Registered Number 1916768 Website: www.teamenergy.com Telephone: +44 (0)1908 690018