Sigma Online User Manual
Emissions Reports in EI
- Kim Blake
This page shows Reports that include Emissions Factors (aswell as Cost and Consumption for example).
The first column has a link that will open the Report in Energy Intelligence.
Click on the link in the table to take you directly into the Report in Energy Intelligence in your own database.
Report Link - click on the link to log into Sigma and view the Report | Thumbnail | Report Description |
| Billed Cost, Consumption and Carbon Emissions | 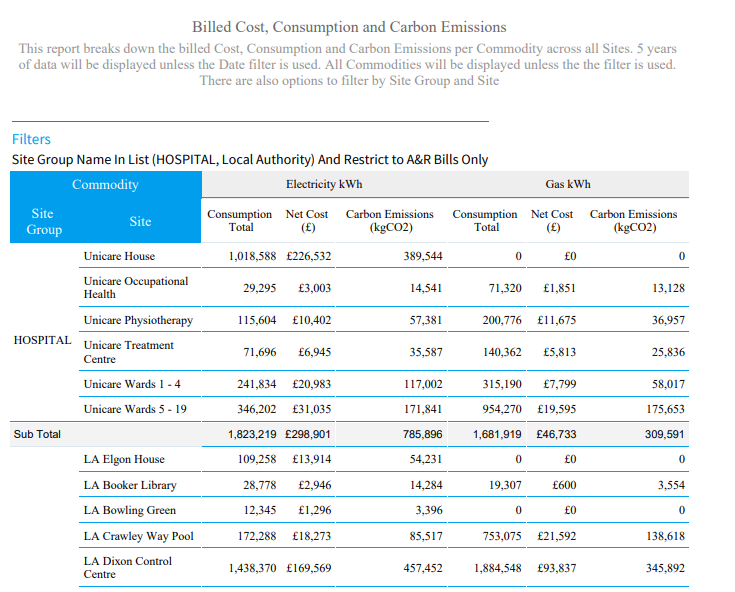 | Billed Cost, Consumption and Carbon EmissionsBreaks down the billed Cost, Consumption and Carbon Emissions per Commodity across all Sites. 5 years of data will be displayed unless the Date filter is used. All Commodities will be displayed unless the the filter is used. EI View: Billed Consumption |
| Billed Cost, Consumption and CO2 by Commodity (Stacked bar chart) | 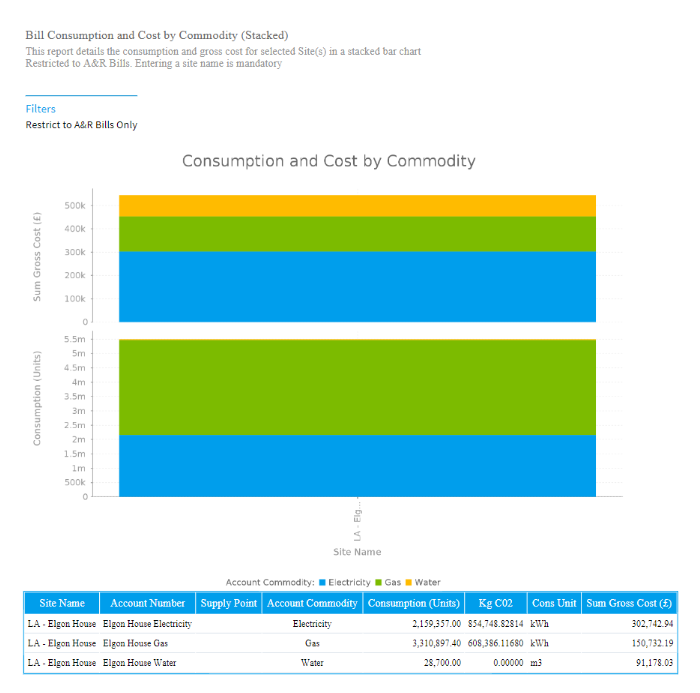 | Billed Cost, Consumption and CO2 by Commodity (Stacked bar chart)Details the consumption and gross cost for selected Site(s) in a stacked bar chart. EI View: Billed Consumption |
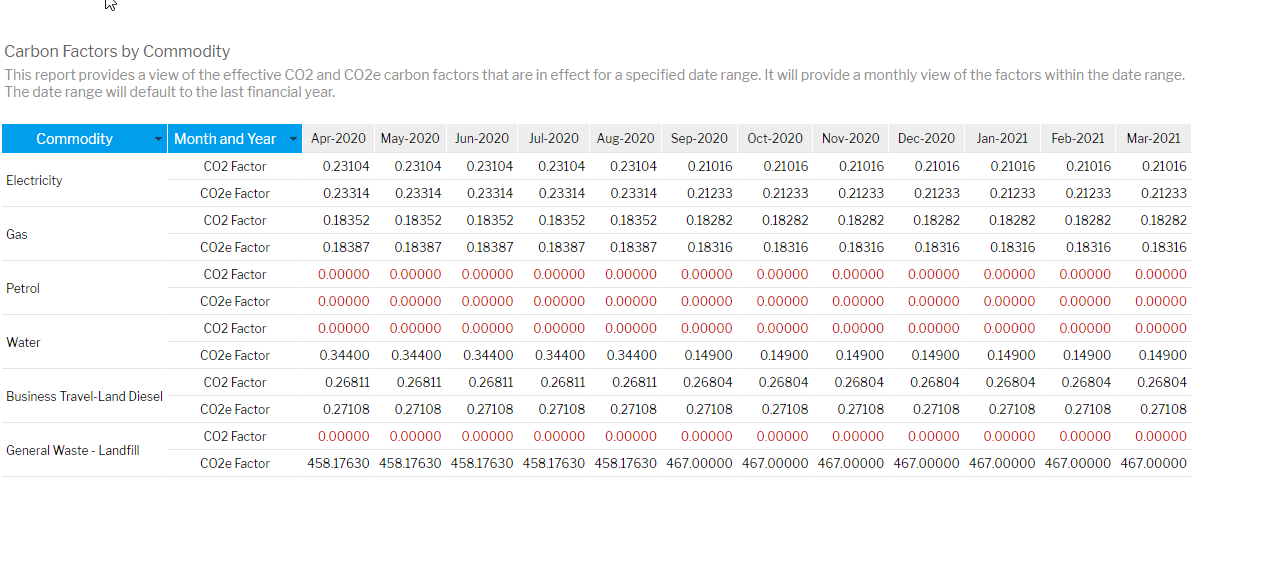
| Carbon Factors by Commodity |
| Carbon Factors by CommodityThis report provides a view of the effective CO2 and CO2e carbon factors that are in effect for a specified date range. It will provide a monthly view of the factors within the date range. The date range will default to the last financial year. A red zero indicates that no factor is available (either standard or custom), a black zero indicates that no data is available, therefore the factor can not be exported EI View: Best Available Data |
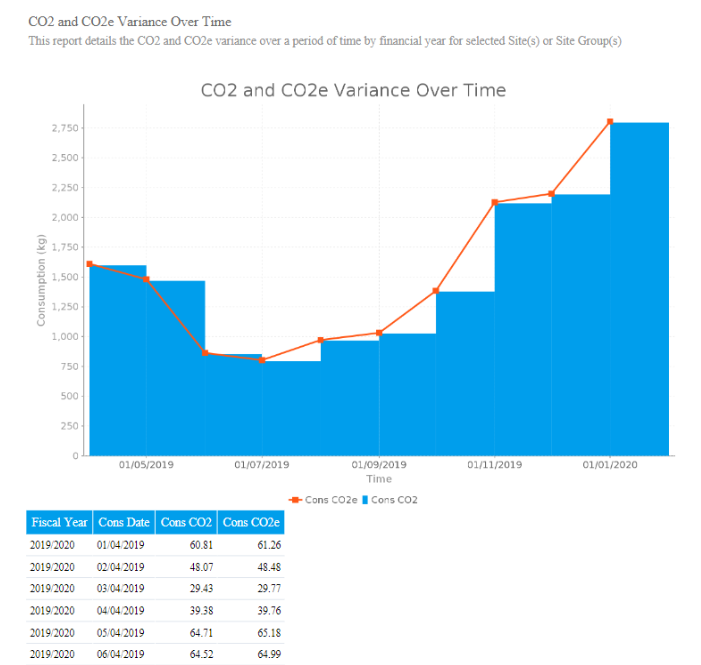
CO2 and CO2e Variance Over Time (Best Available Data) |
| CO2 and CO2e Variance Over Time (Best Available Data)Details the CO2 and CO2e variance over a period of time by financial year for selected Site(s) or Site Group(s) EI View: Best Available Data |
(part of the Emission Summary Dashboard) |
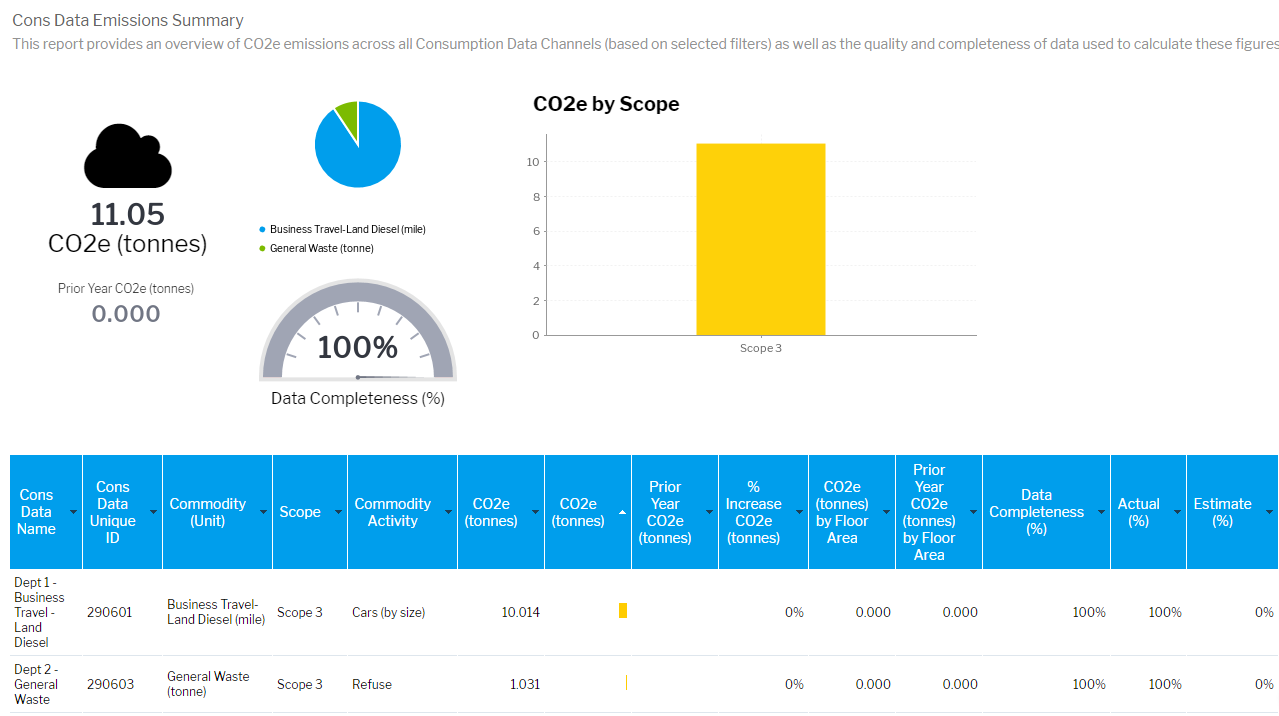
| Cons Data Emissions SummaryThis report provides an overview of CO2e emissions across all Consumption Data Channels (based on selected filters) as well as the quality and completeness of data used to calculate these figures EI View: Best Available Data |
| Daily Emissions Data Audit |
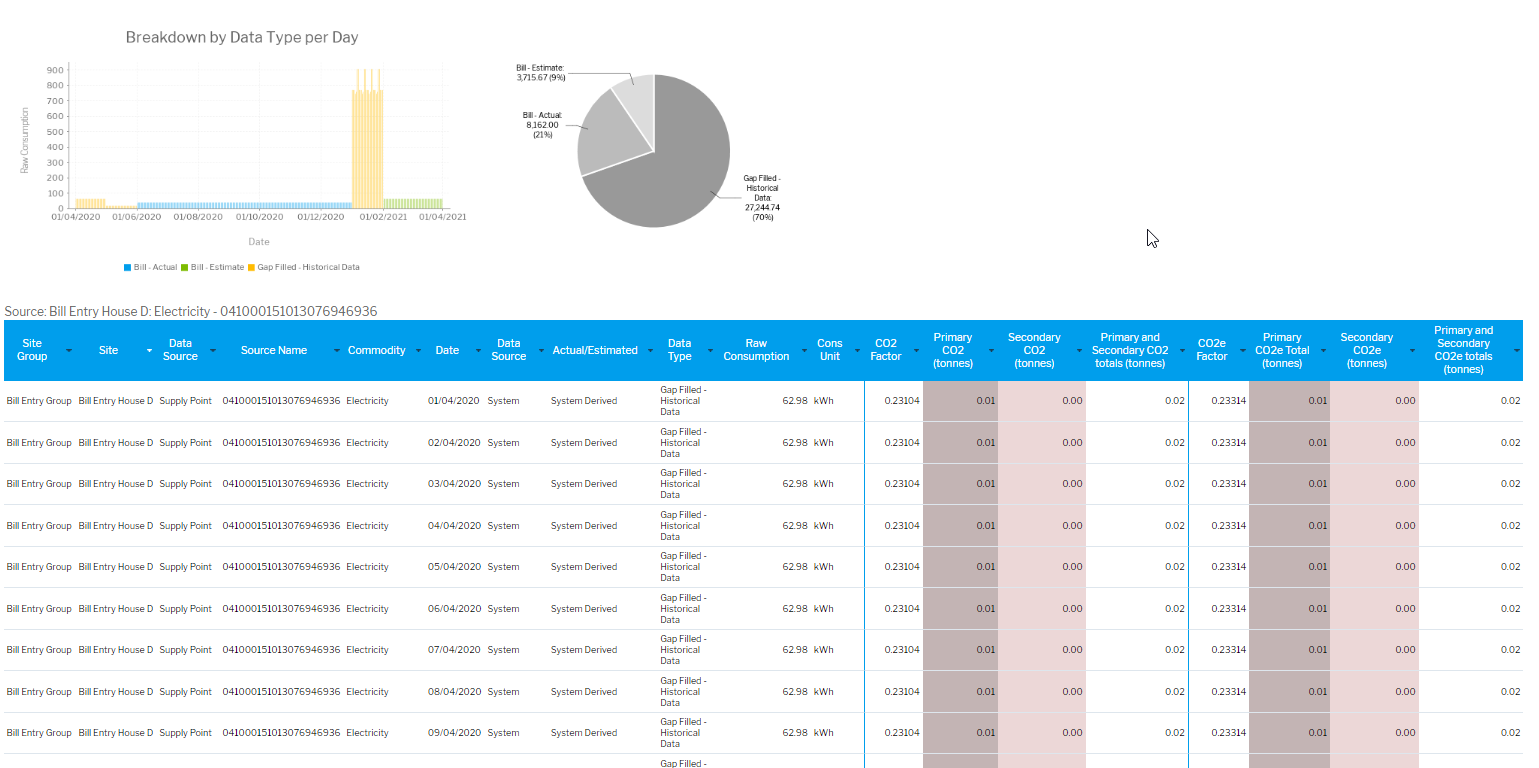
| Daily Emissions Data AuditUsing the Sigma Best Available Consumption View, this report shows the Emissions Factors, the Primary, Secondary CO2 and CO2e Emissions, followed by the CO2 and CO2e totals for a given Supply Point or Consumption Data item for each day. It also shows the source (e.g. Bills) and Type (e.g. Estimated) of data. EI View: Best Available Data |
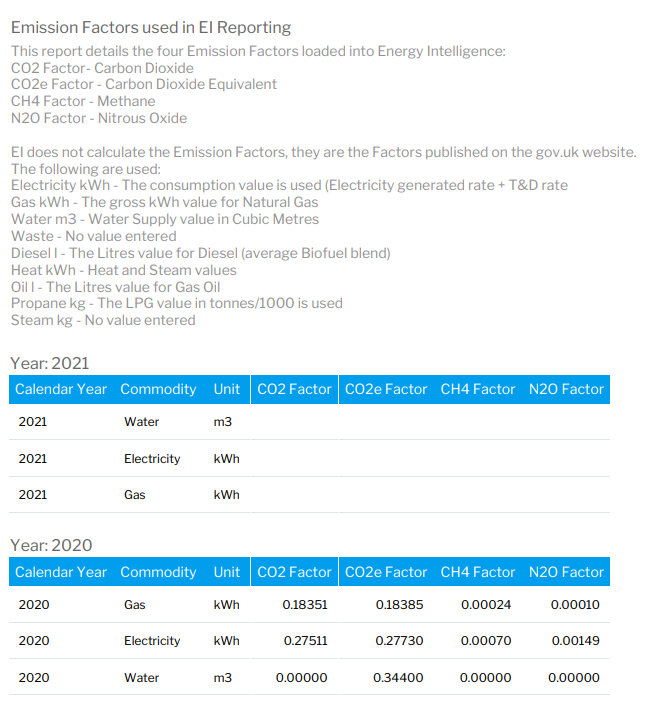
| Emission & Conversion Factors used in EI Reporting |
| Emission & Conversion Factors used in EI ReportingThis report details the four standard Emission Factors loaded into Energy Intelligence: EI does not calculate the Conversion Factors, but uses the values for the Category, Activity and Sub category for the Commodity as published on the gov.uk website. EI View: Best Available Data |
(part of the Emission Summary Dashboard) |
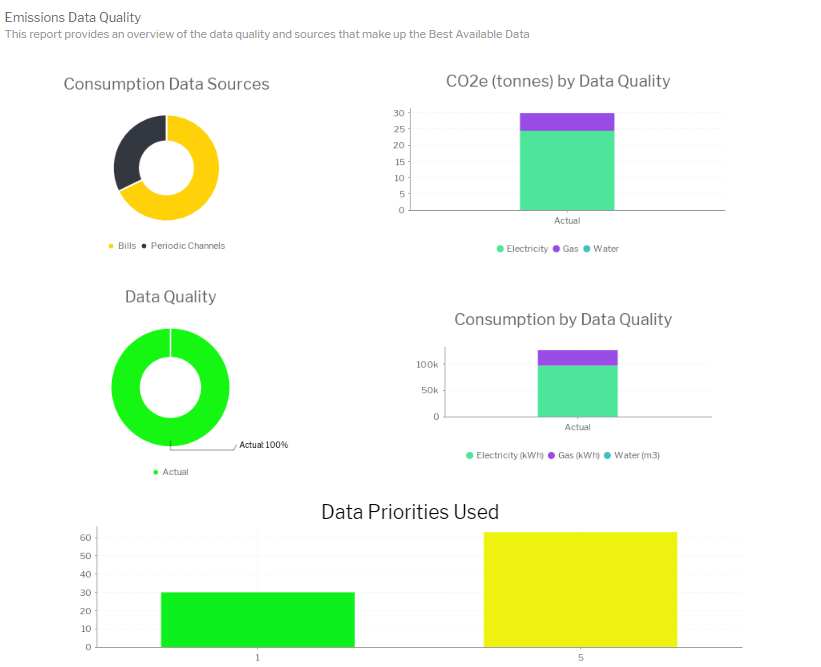
| Emissions Data QualityProvides an overview of the data quality and sources that make up the Best Available Data EI View: Best Available Data |
| Emissions Report (Best Available Data) |
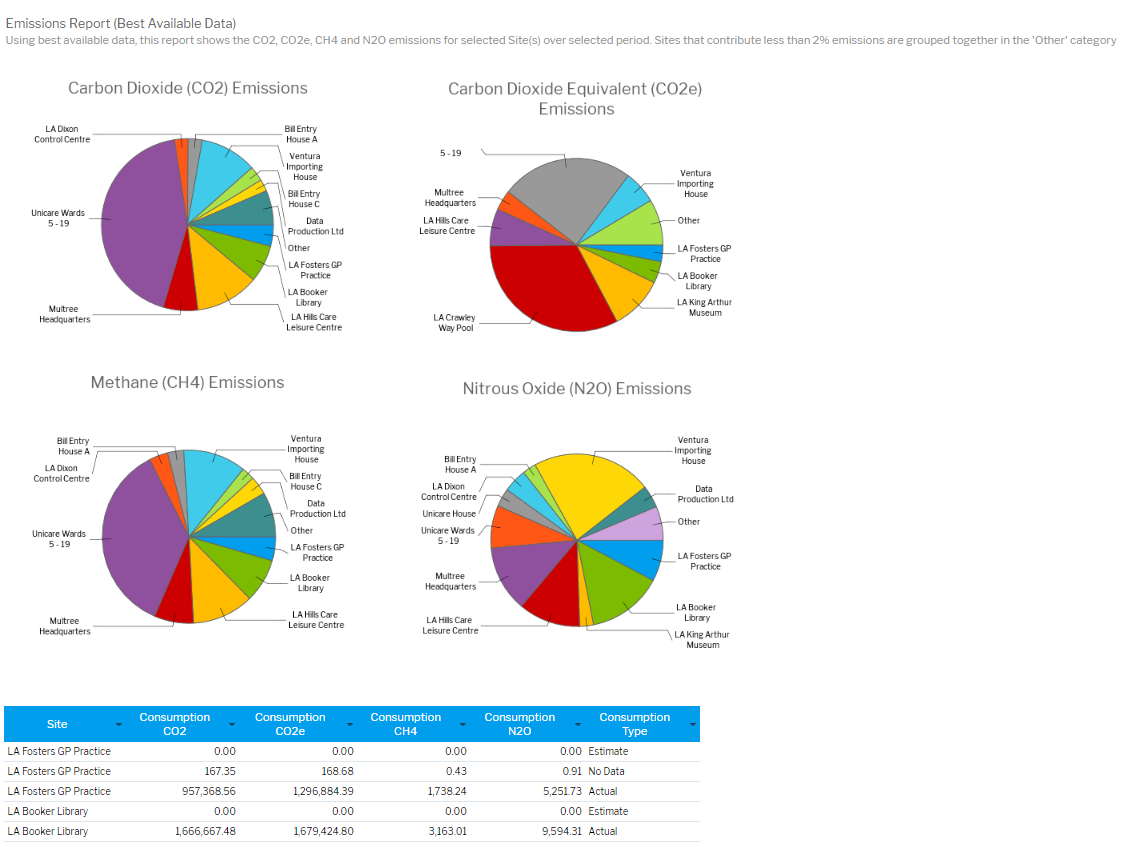
| Emissions Report (Best Available Data)Shows the CO2, CO2e, CH4 and N2O emissions for selected Site(s) over selected period. Sites that contribute less than 2% emissions are grouped together in the 'Other' category EI View: Best Available Data. |
(part of the Emission Summary Dashboard) |
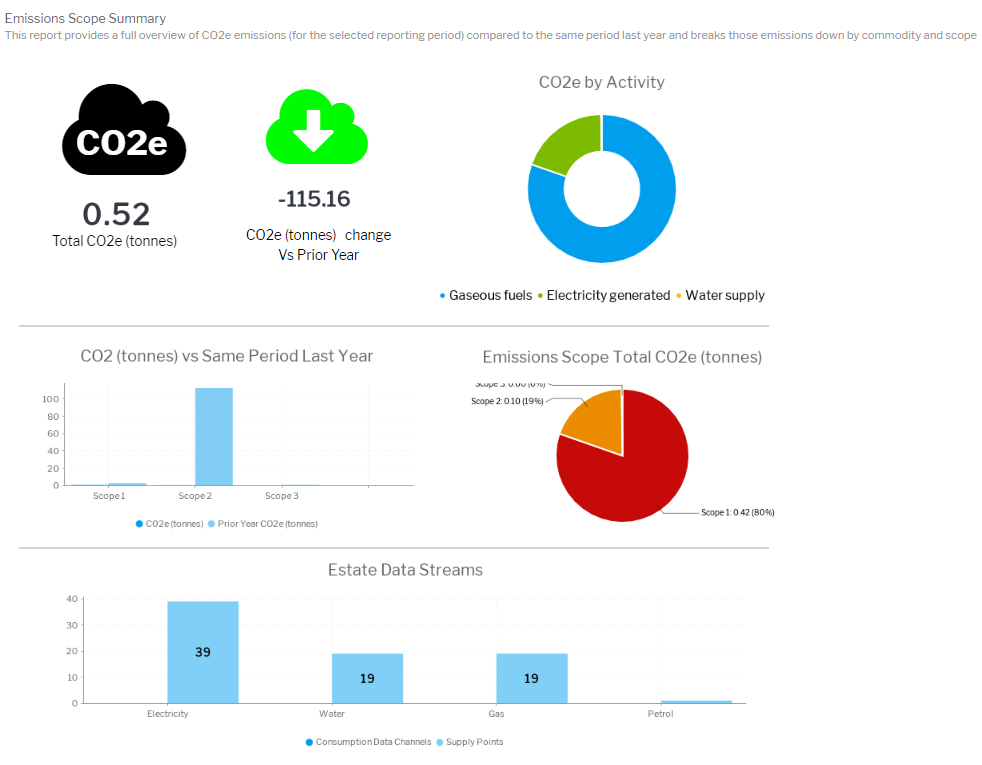
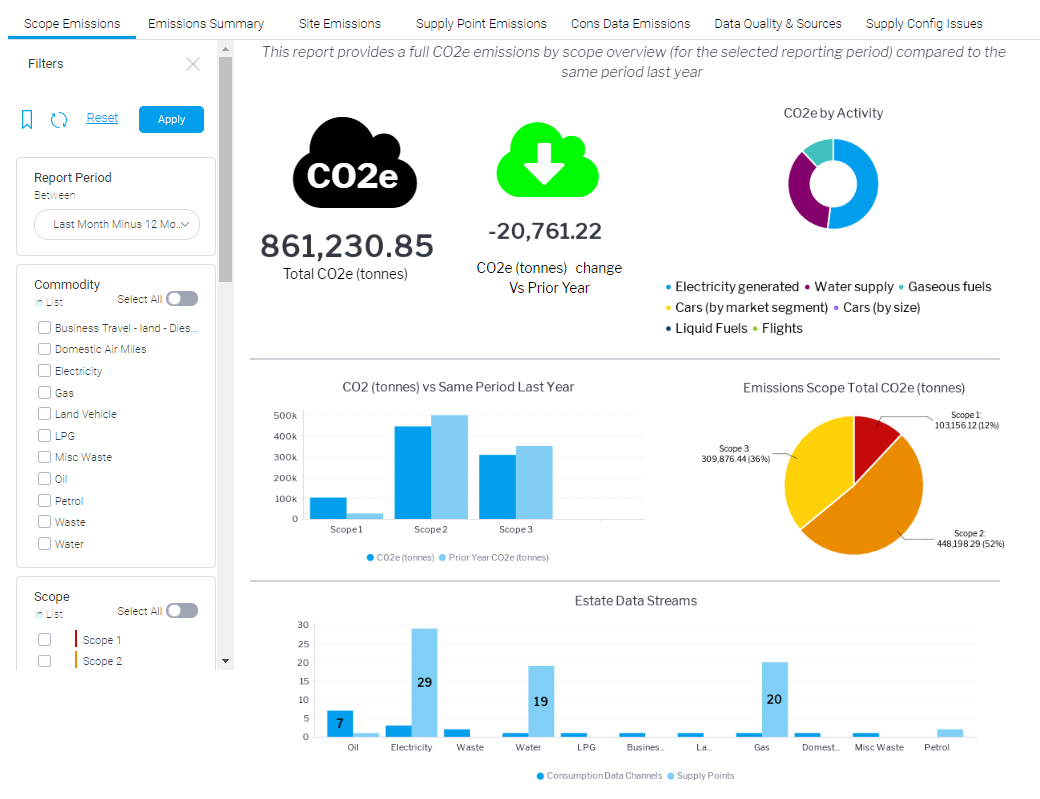
| Emissions Scope SummaryThis report provides a full overview of CO2e emissions (for the selected reporting period) compared to the same period last year and breaks those emissions down by commodity and scope EI View: Best Available Data |
(part of the Emission Summary Dashboard) |
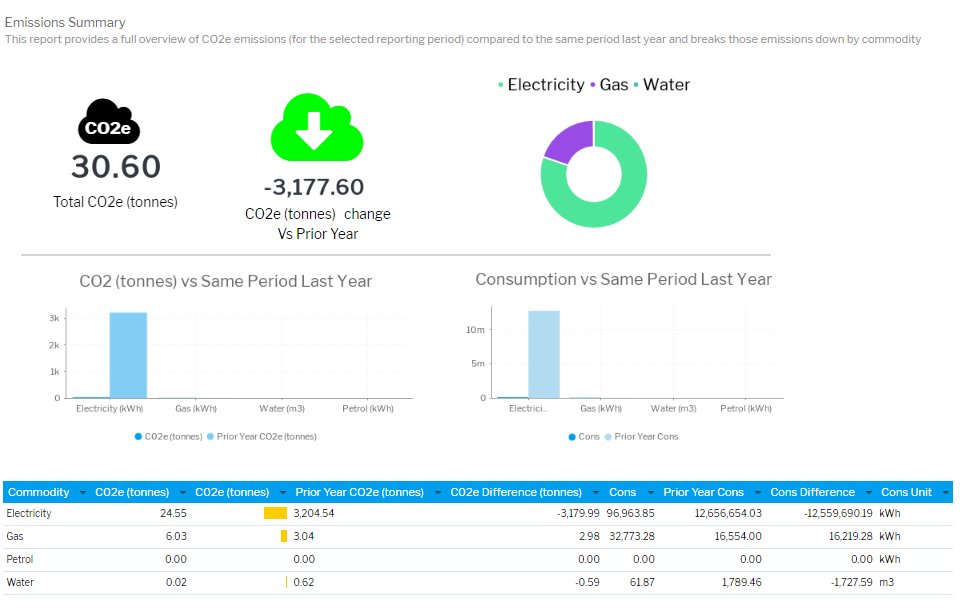
| Emissions SummaryProvides a full overview of CO2e emissions (for the selected reporting period) compared to the same period last year and breaks those emissions down by commodity EI View: Best Available Data |
| Emissions Summary Dashboard |
| Emissions Summary DashboardThe Dashboard consists of 7 tabs and 12 reports
EI View: Best Available Data |
Site Billed CO2 (stacked by Commodity)Site Billed CO2 (stacked by Commodity) | 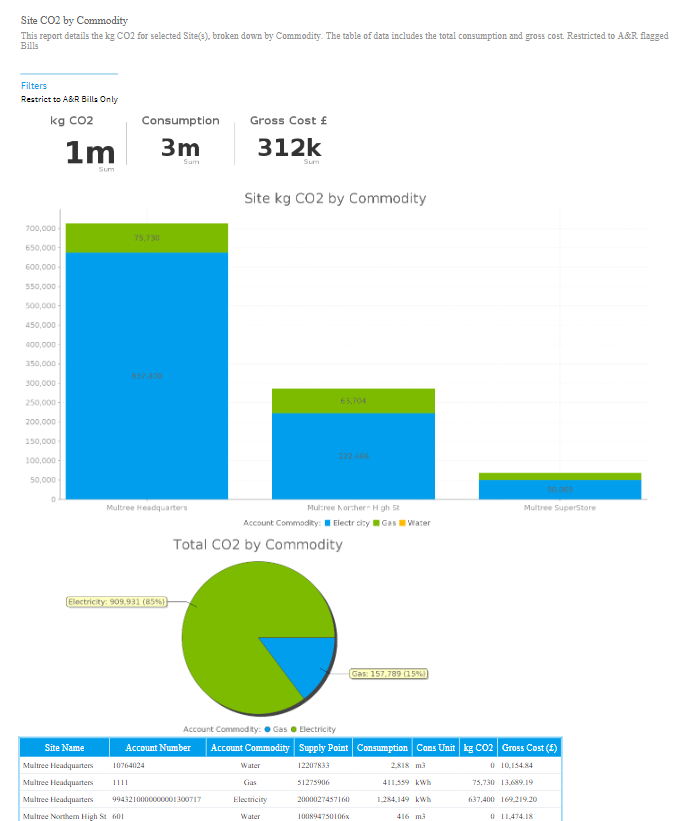 | Details the kg CO2 from the Accounts in selected Site(s), broken down by Commodity. The table of data includes the total consumption and gross cost. EI View: Billed Consumption |
| Site Billed CO2 Emission Comparison for a Period | 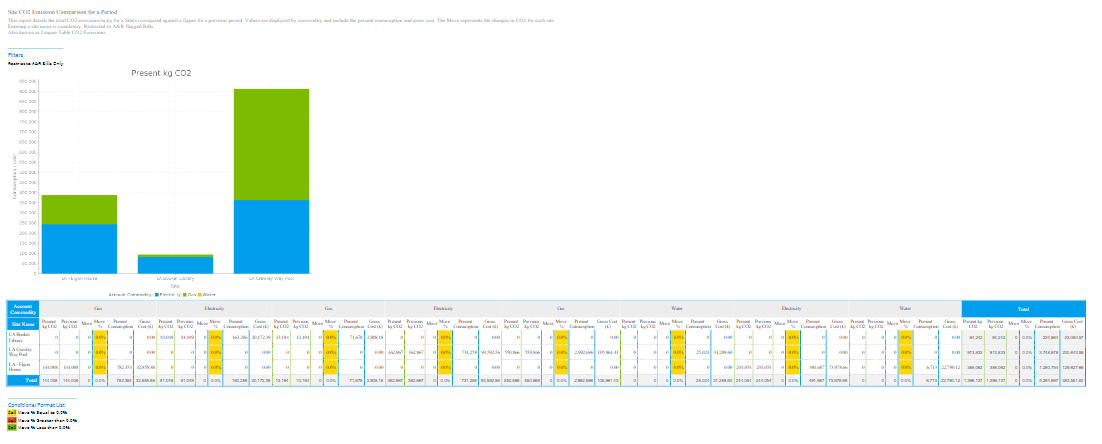 | Site Billed CO2 Emission Comparison for a PeriodDetails the total CO2 emissions in kg for a Site(s) compared against a figure for a previous period. Values are displayed by commodity and include the present consumption and gross cost. The Move represents the changes in CO2 for each site. Also known as League Table CO2 Emissions. EI View: Billed Consumption |
| Site Billed Consumption Comparison for Selected Periods (includes Cost and CO2) | 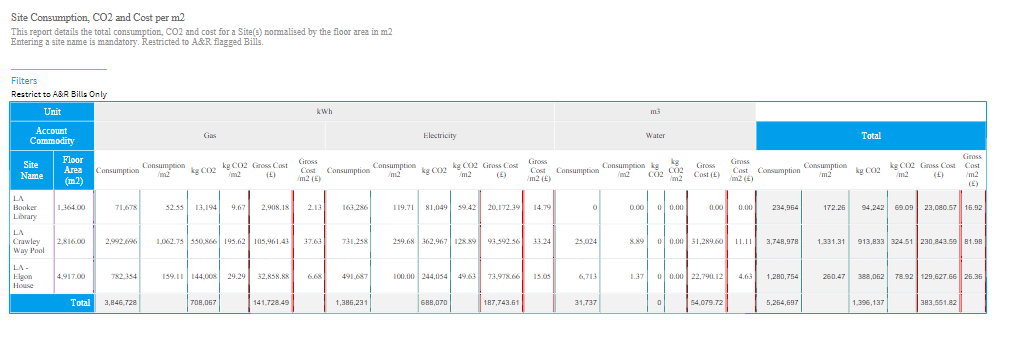 | Site Billed Consumption Comparison for Selected Periods (includes Cost and CO2)Details the consumption for a Site(s) compared against a figure for a previous period. Values are displayed by commodity and include the present kg CO2 and gross cost. The Move column in the results table represents the changes in Consumption for each site. Also known as League Table Any Period. EI View: Billed Consumption |
| Site Billed Consumption, CO2 and Cost per m2 | 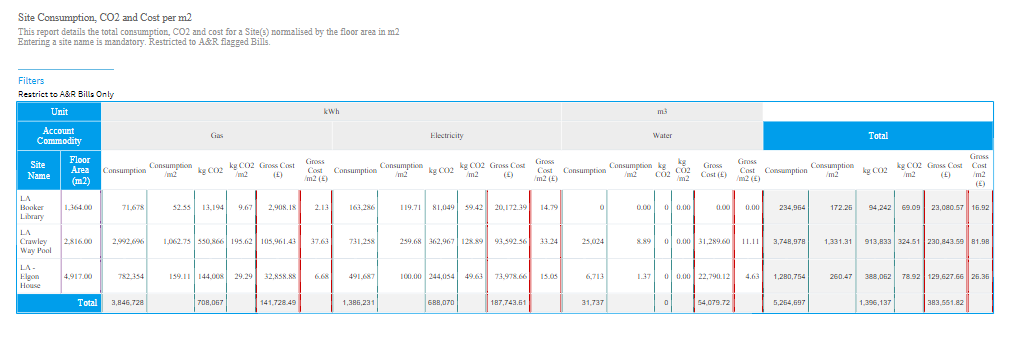 | Site Billed Consumption, CO2 and Cost per m2Details the total consumption, CO2 and cost for a Site(s) normalised by the floor area in m2 EI View: Billed Consumption |
| Site Billed Consumption, CO2 and Cost per Person | 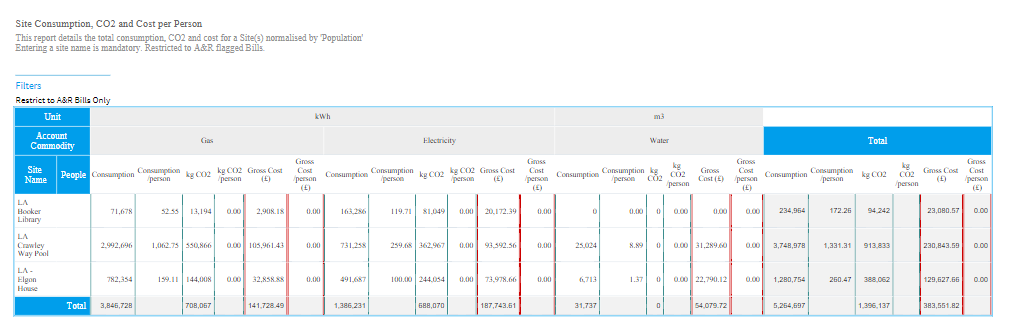 | Site Billed Consumption, CO2 and Cost per PersonDetails the total consumption, CO2 and cost for a Site(s) normalised by 'Population' EI View: Billed Consumption |
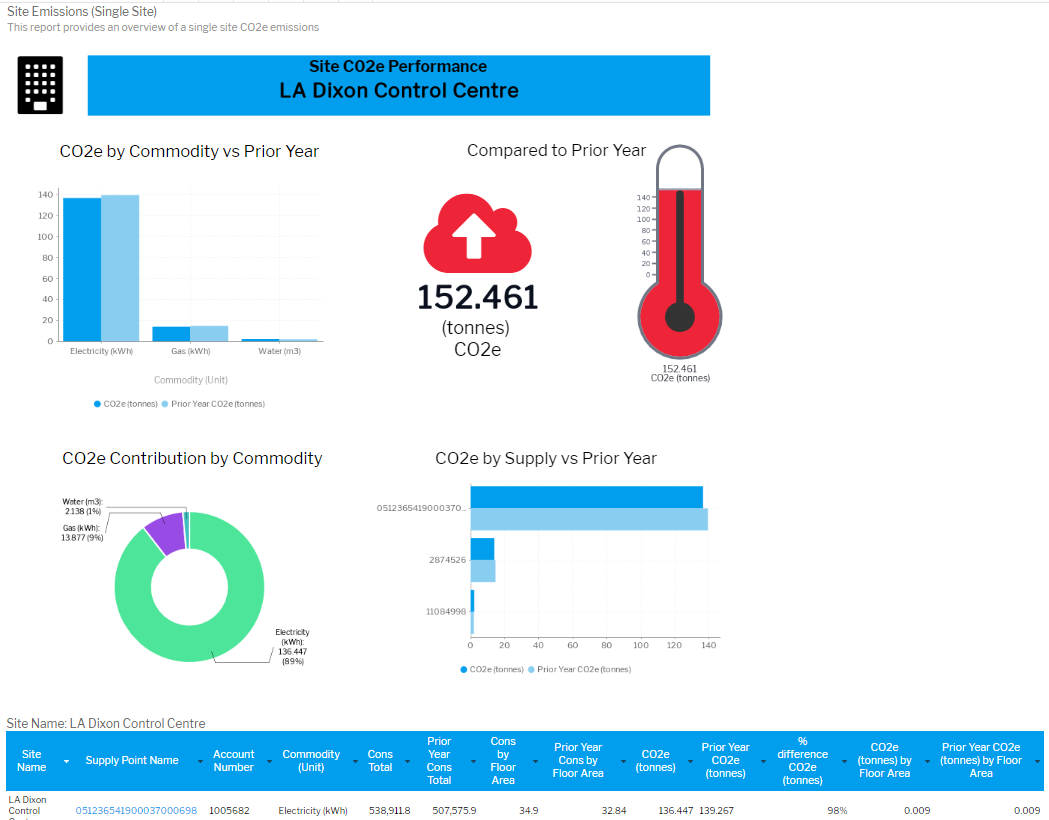
| Site Emissions (Single Site) |
| Site Emissions (Single Site)Provides an overview of a single site CO2e emissions EI View: Best Available Data |
(part of the Emission Summary Dashboard) |
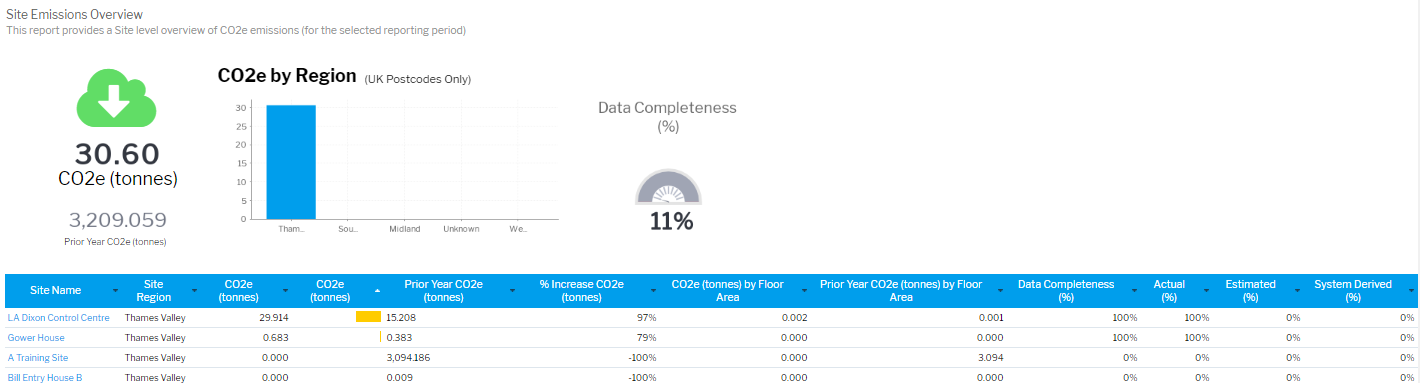
| Site Emissions OverviewProvides a Site level overview of C02 emissions (for the selected reporting period) EI View: Best Available Data |
(part of the Emission Summary Dashboard) |
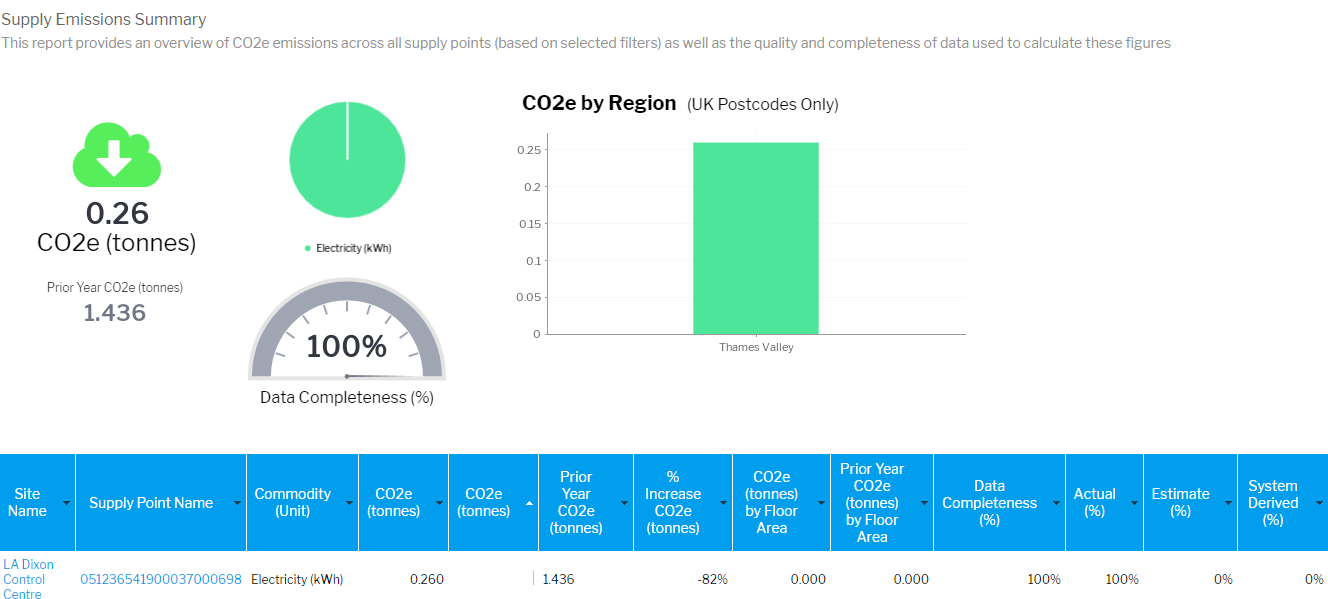
| Supply Emissions SummaryProvides an overview of the C02e emissions across all supply points (based on selected filters) as well as the quality and completeness of data used to calculate these figures. Links to the Supply Points Emissions (Single Supply) Report EI View: Best Available Data |
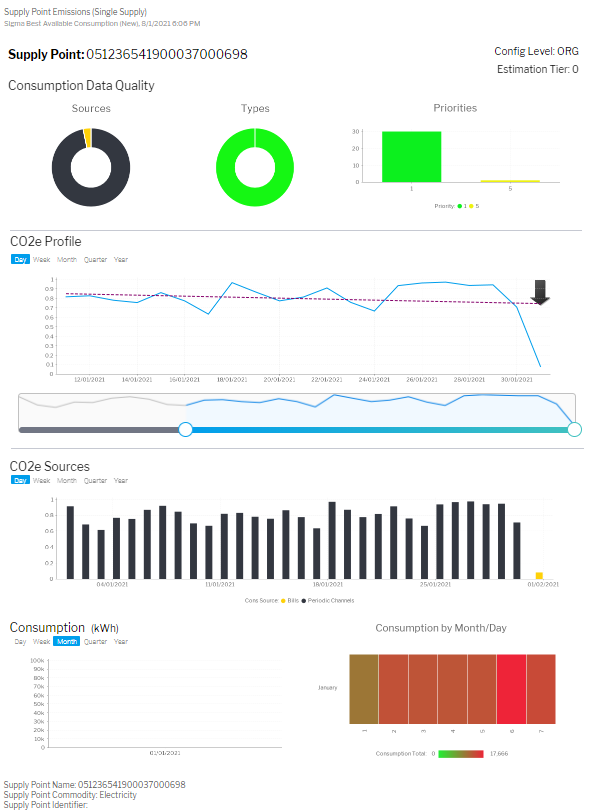
| Supply Point Emissions (Single Supply) |
| Supply Point Emissions (Single Supply)Shows details of a single Supply Point such as the data quality, C02e profile, C02e source and consumption Links from the Supply Points Emissions Report EI View: Best Available Data |
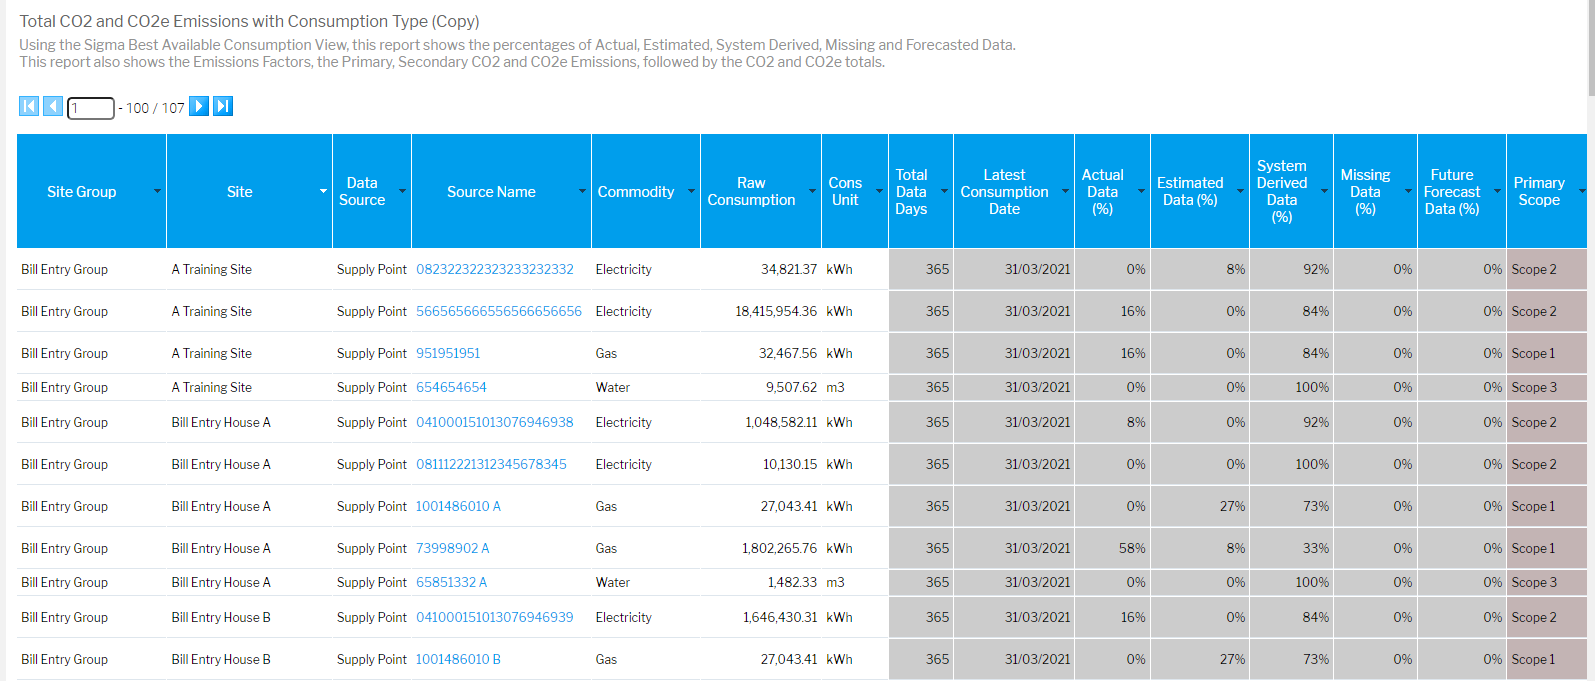
| Total CO2 and CO2 Emissions by Consumption Source |
| Total CO2 and CO2e Emissions by Consumption SourceUsing the Sigma Best Available Consumption View, this report shows the percentages of Actual, Estimated, System Derived, Missing and Forecasted Data. This report also shows the Emissions Factors, the Primary, Secondary CO2 and CO2e Emissions, followed by the CO2 and CO2e totals. This report drills through to the Daily Emissions Data Report EI View: Best Available Data |
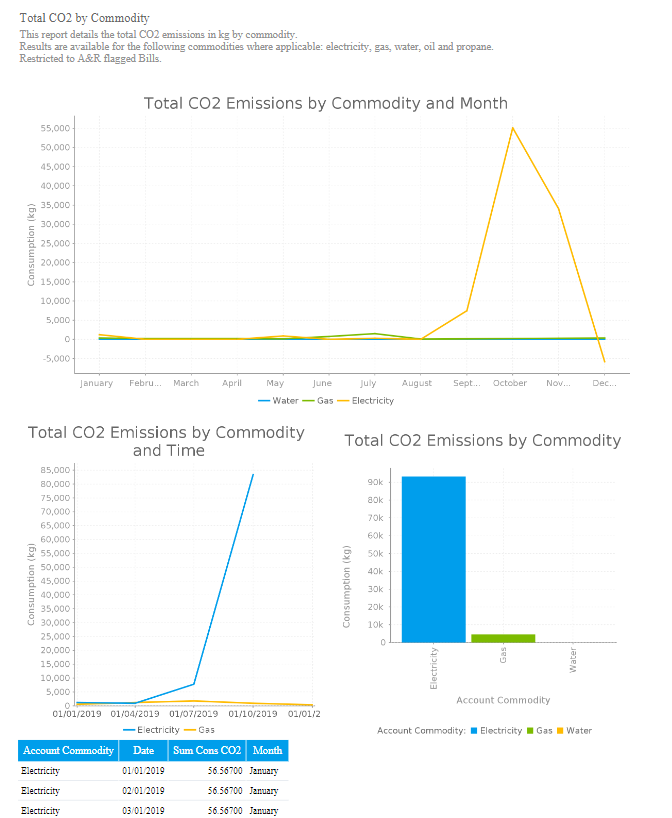
| Total CO2 by Commodity |
| Total CO2 by CommodityDetails the total CO2 emissions in kg by commodity. EI View: Billed Consumption |
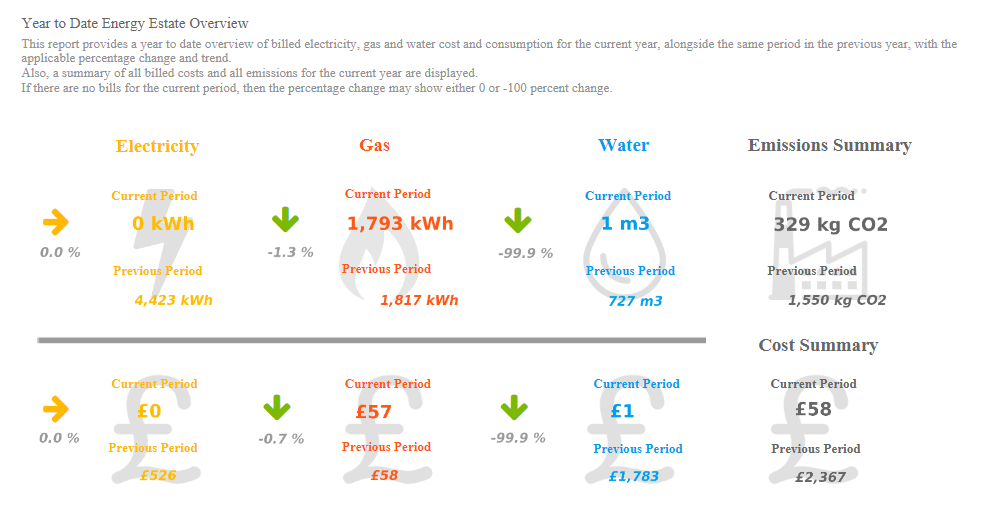
| Year to Date Billed Energy Overview |
| Year to Date Billed Energy OverviewProvides a year to date overview of billed electricity, gas and water cost and consumption for the current year, alongside the same period in the previous year, with the applicable percentage change and trend. EI View: Billed Consumption |
@ Copyright TEAM - Energy Auditing Agency Limited Registered Number 1916768 Website: www.teamenergy.com Telephone: +44 (0)1908 690018