Sigma Online User Manual
Meters - Data Monitoring Notifications EI Reports
- Kim Blake
This page shows Reports that use the Meters - Data Monitoring Notifications View. The first column has a link that will open the Report in Energy Intelligence.
Click on the link in the table to take you directly into the Report in Energy Intelligence in your own database.
Report Link - click on the link to log into Sigma and view the Report | Thumbnail | Report Description |
| Data Monitoring Notifications |
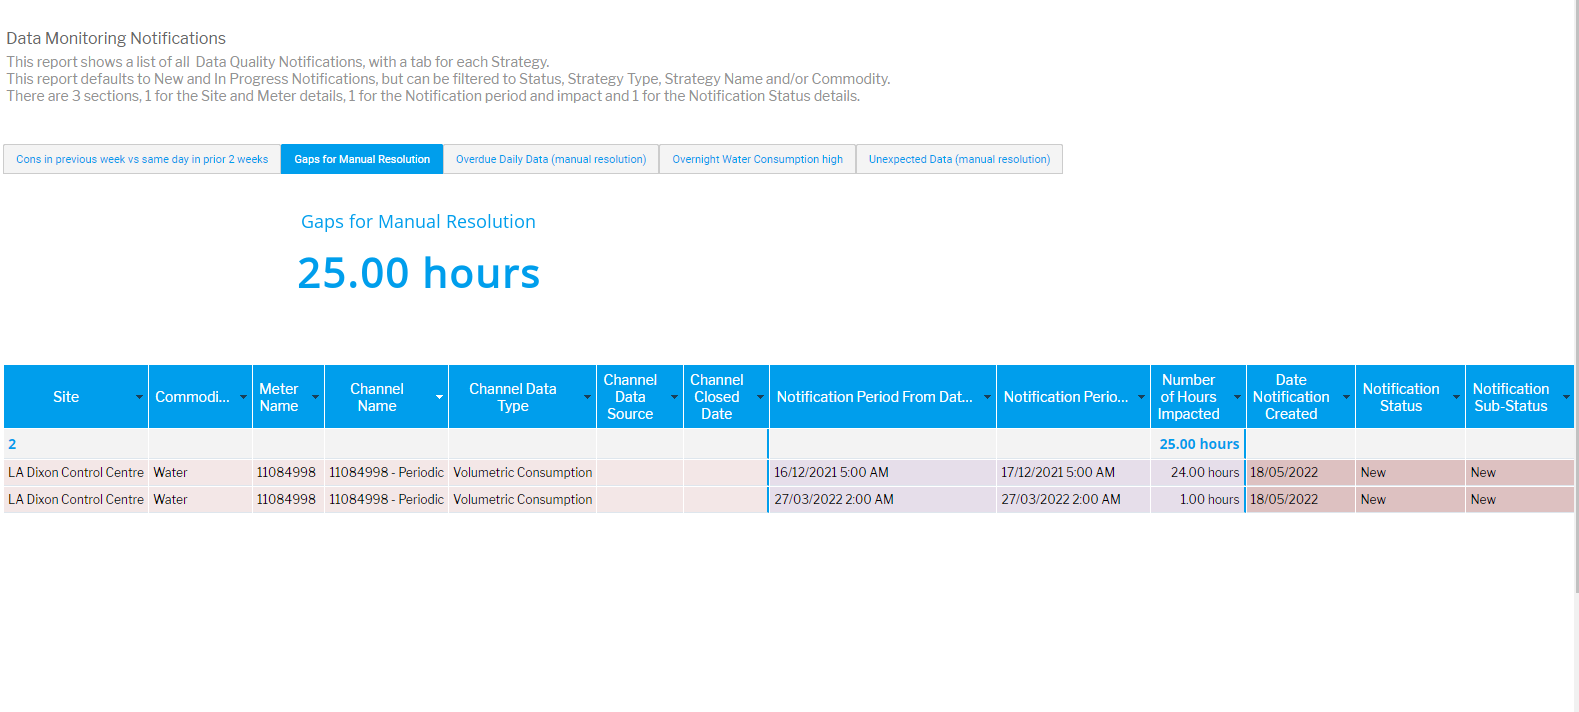
| Data NotificationsThis report shows a list of all Data Quality Notifications, with a tab for each Strategy. This report defaults to New and In Progress Notifications, but can be filtered to Status, Strategy Type, Strategy Name and/or Commodity. There are 3 sections, 1 for the Site and Meter details, 1 for the Notification period and impact and 1 for the Notification Status details. |
| Data Monitoring - Data Quality Overview |
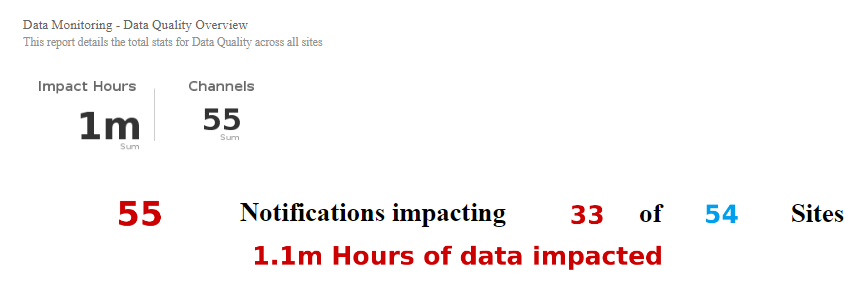
| Data Monitoring - Data Quality OverviewDetails the total stats for Data Quality across all sites. |
| Data Monitoring - Data Quality Total Stats |
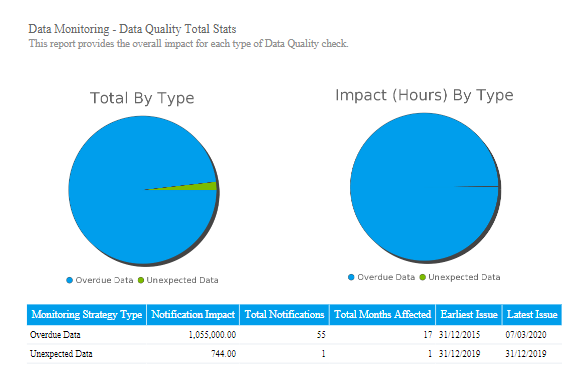
| Data Monitoring - Data Quality Total StatsProvides the overall impact for each type of Data Quality check. |
| Data Monitoring - List of Quality Notifications |
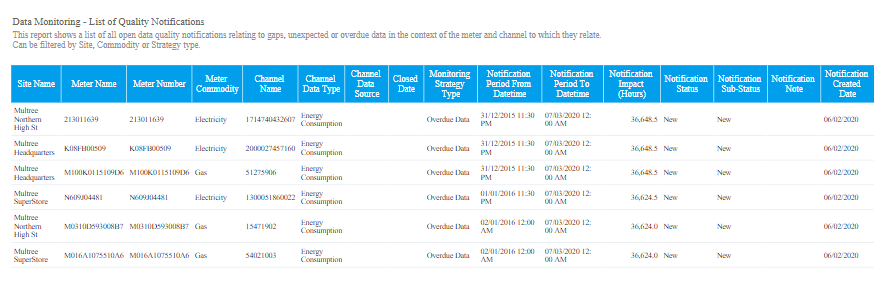
| Data Monitoring - List of Quality NotificationsShows a list of all open data quality notifications relating to gaps, unexpected or overdue data in the context of the meter and channel to which they relate. |
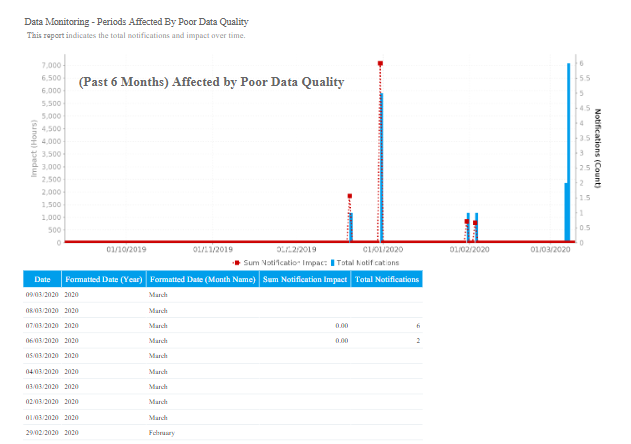
| Data Monitoring - Periods Affected By Poor Data Quality |
| Data Monitoring - Periods Affected By Poor Data QualityIndicates the total notifications and impact over time. |
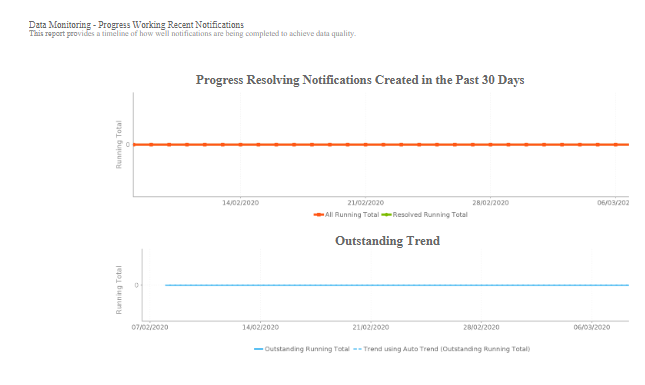
| Data Monitoring - Progress Working Recent Notifications |
| Data Monitoring - Progress Working Recent NotificationsProvides a timeline of how well notifications are being completed to achieve data quality. |
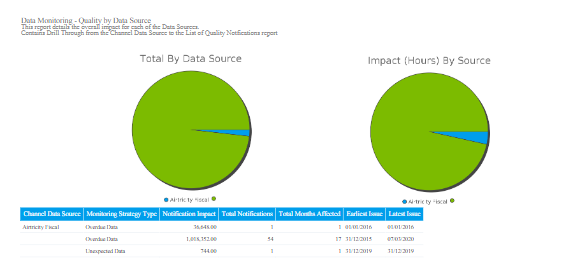
| Data Monitoring - Quality by Data Source |
| Data Monitoring - Quality by Data SourceDetails the overall impact for each of the Data Sources. Contains Drill Through from the Channel Data Source to the List of Quality Notifications report |
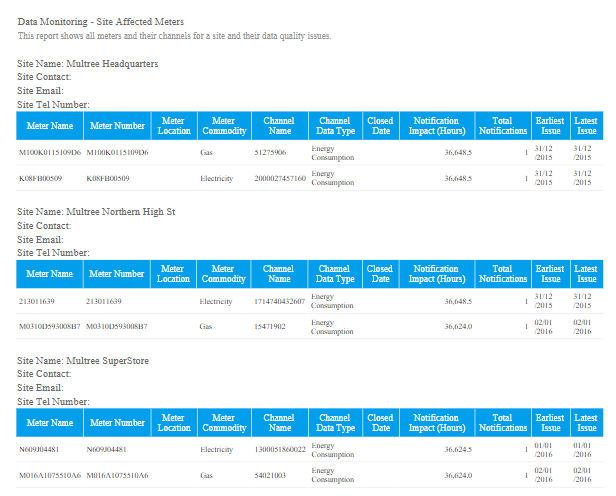
| Data Monitoring - Site Affected Meters |
| Data Monitoring - Site Affected MetersShows all meters and their channels for a site and their data quality issues. |
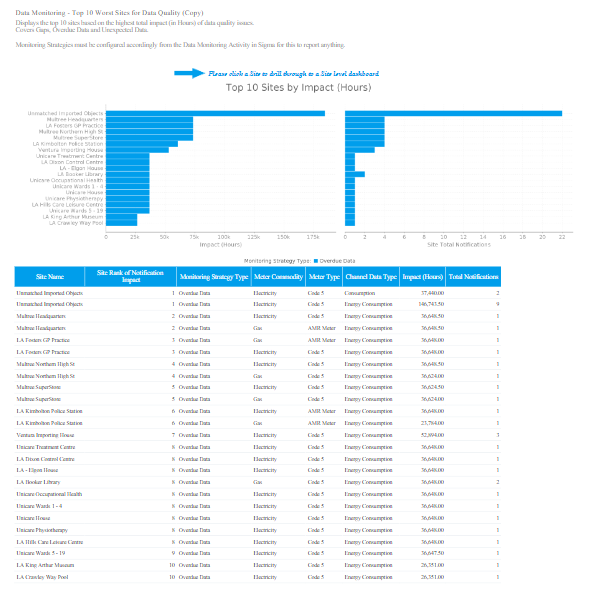
| Data Monitoring - Top 10 Worst Sites for Data Quality |
| Data Monitoring - Top 10 Worst Sites for Data QualityDisplays the top 10 sites based on the highest total impact (in Hours) of data quality issues. |
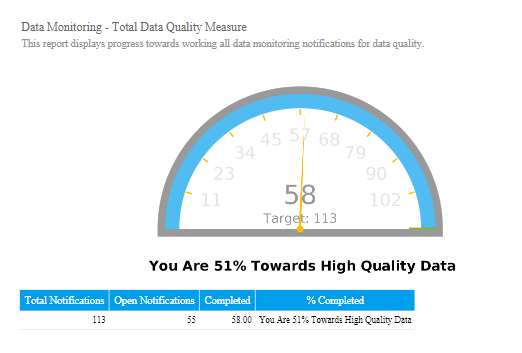
| Data Monitoring - Total Data Quality Measure |
| Data Monitoring - Total Data Quality MeasureDisplays progress towards working all data monitoring notifications for data quality. |
| Data Quality Dashboard |
| Data Quality DashboardProvides you with a complete overview of your data quality issues covering gaps, overdue and unexpected data across your estate. You must first ensure you have configured monitoring strategies within the Data Monitoring Activity within Sigma before any data will be displayed here. *Search for the Data Quality Dashboard in Energy Intelligence |
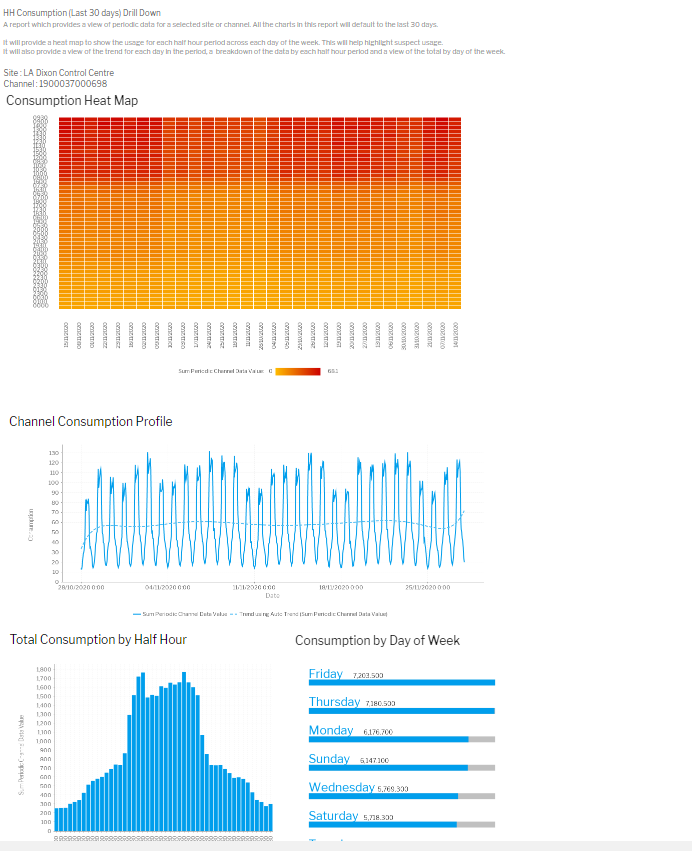
| HH Consumption (Last 30 days) Drill Down |
| HH Consumption (Last 30 days) Drill DownProvides a view of periodic data for a selected site or channel. All the charts in this report will default to the last 30 days. It will provide a heat map to show the usage for each half hour period across each day of the week. This will help highlight suspect usage. It will also provide a view of the trend for each day in the period, a breakdown of the data by each half hour period and a view of the total by day of the week. |
| Site Data Quality |
| Site Data DashboardA combination of 5 different Data Quality reports, brought together on one Dashboard |


@ Copyright TEAM - Energy Auditing Agency Limited Registered Number 1916768 Website: www.teamenergy.com Telephone: +44 (0)1908 690018