Sigma Online User Manual
Meters & Channels Tab
- Tom Anderton
- Kim Blake
- Graham Paul
The Meters & Channels Tab provides an overview of all the Meters and Channels connected to the selected Site. Please see the related links for the definition of Meters and Channels (of which there are two types: Periodic or Non-periodic).
It details key information relating to the Meters and their associated Periodic or Non Periodic Channels, shows a graph of the selected Meters consumption and links to all related Items such as Site, Account etc. From here you can edit/add Meters and Channels, browse the data, view any Associated Data and go straight to other Activities such as Data Monitoring and Reporting in the context of the selected Meter or Channel.
If you do not have these items in your database, click here for details on how to add Sites, Accounts, Meters, Channels and Contracts.
The screen is divided into 4 sections:
Opening the Meters & Channels Tab
Open the Estate Management Activity.
Highlight a Site in the Data Selector.
Click on the Meters & Channels Tab OR click on the Meters Pie Chart OR click on the Channels Bar Chart.
Meters
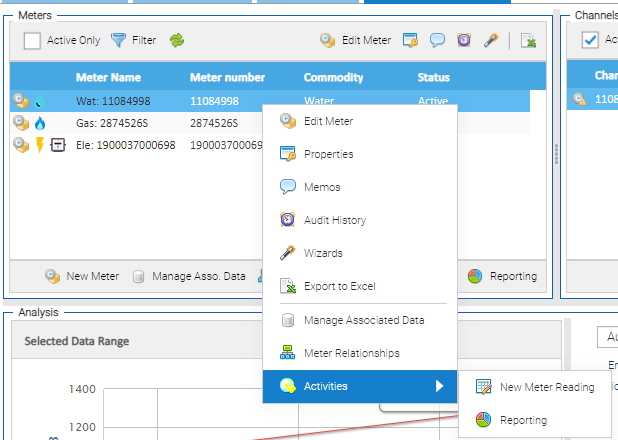
This section details all of the Meters associated to the selected Site. Details such as the Meter Name, Commodity and Status can be seen. From here, you can edit the existing meter, add a new meter, and readings, view memos, use the available Wizards to add new Monitoring Points or apply Data Permissions to restrict access to your assets for certain Users. You can also go straight to the Reporting Activity and view the Meter Relationships (ie the Parent/Child Relationship).
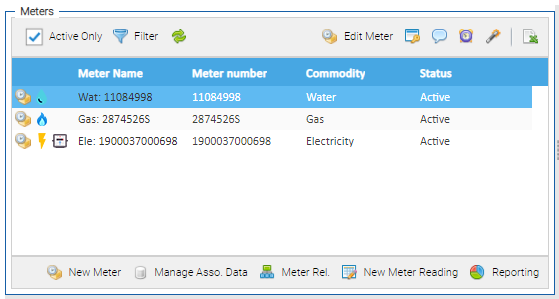
- Right clicking on the table heading will allow additional columns to be added, or any of the existing ones removed.
- To minimise the Meters and Channels sections in the top half of the screen, click on the ellipsis
 at the bottom of the sections. To maximise, click again.
 - Clicking on a different Meter in this section will change the details displayed in the other sections on the screen (Channels, Analysis and Related Items)
Options
| Option | Description |
|---|---|
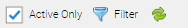
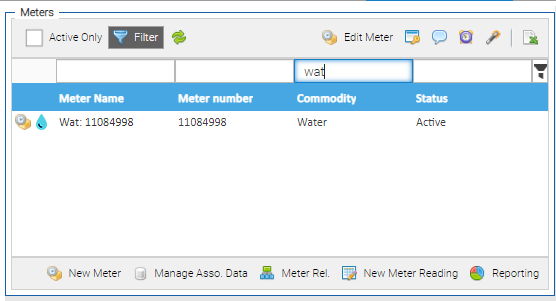
| Active Only | By default this is ticked and the screen will show only Active Meters, unticking will show Active and Inactive Meters. Any inactive Meters will be highlighted in red. An Inactive Meter is where the "De-energised" checkbox has been ticked and the de-energisation date entered is in the past OR where the "Use installation date" checkbox is ticked and the date entered is in the future.
|
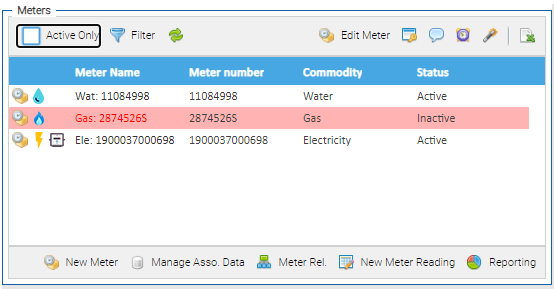
| Filter | Click to open the Filter option which will display above the table headings. It is search as you type so the filtering will start applying as soon as you start typing. For example, to filter to only the Electricity Meters, type Ele and it will show just the Electricity ones.
|
| Refresh | Refreshes the screen |
| Option | Description |
|---|---|
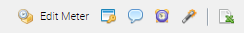
Edit Meter
| Opens the Meter Editor for the selected Meter in the list. |
Properties
| Opens the Properties Tab in the Meter Editor for the selected Meter in the list. |
Memos
| Opens the Memos Tab in the Meter Editor for the selected Meter in the list. |
Audit History
| Opens the History Tab in the Meter Editor for the selected Meter in the list. |
Wizards
| Provides the ability to access the Monitoring Point or Data Permissions Wizards for the selected Meter. |
Export to Excel
| Exports an Excel spreadsheet of the data in the section. |


| Option | Description |
|---|---|
| New Meter | Allows a new Meter, Sub Meter or Virtual Meter to be created for the Site. It will open up the appropriate Item Editor pop-up so the relevant details for the asset can be entered. |
| Manage Associated Data | Provides the ability to Manage the Associated Data Channels that are linked to the selected Meter. |
| Meter Rel. | Shows the Parent/Child relationship of the Meters. |
| New Meter Reading | Opens the Data Input Activity in the context of the selected Meter (providing the meter has a Non Periodic Channel associated with it). Click here for details on how to Enter Meter Readings Manually. |
| Reporting | Opens the Reporting Activity in the context of the selected Meter. |
Right click on a Meter to see the same options as above.
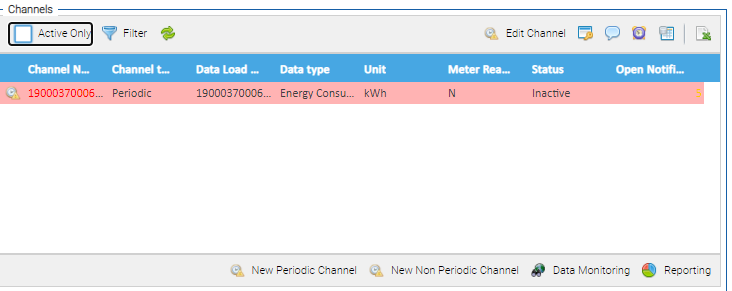
Channels
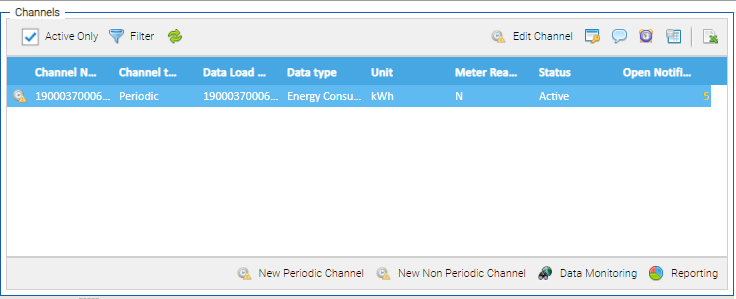
This section shows details of all Channels that are associated with a selected meter. Details such as the Channel Name, Data Load ID, Unit type and Status are shown in the table by default. From here you can edit existing Channels, create new Non Periodic or Periodic Channels, view Memos and Properties. You can also navigate straight to the Data Monitoring and Reporting Activities in the context of a selected Channel.
Options
| Option | Description |
|---|---|
| Active Only | When ticked, the section will show only Active Channels, unticking will show Active and Inactive Channels. Any inactive Channels will be highlighted in red. An Inactive Channel is where the "Closed" checkbox has been ticked and the "date of closure" entered is in the past.
|
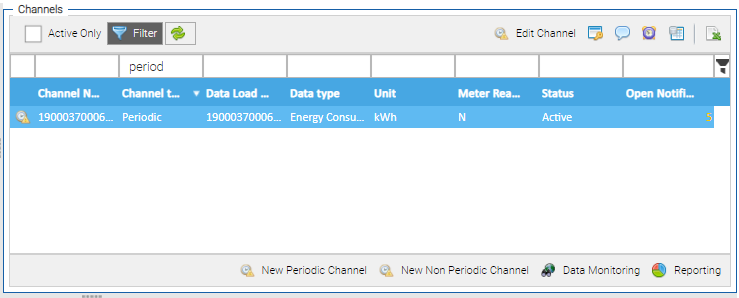
| Filter | Click to open the Filter option which will display above the table headings. It is search as you type so the filtering will start applying as soon as you start typing. For example, to filter to only the Non Periodic Channels, type Non and it will show just the Non Periodic ones.
|
| Refresh | Refreshes the screen. |
| Option | Description |
|---|---|
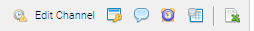
Edit Channel
| Opens the Channel Editor for the selected Channel in the list. |
Properties
| Opens the Properties Tab in the Channel Editor for the selected Channel in the list. |
Memos
| Opens the Memos Tab in the Channel Editor for the selected Channel in the list. |
Audit History
| Opens the History Tab in the Channel Editor for the selected Channel in the list. |
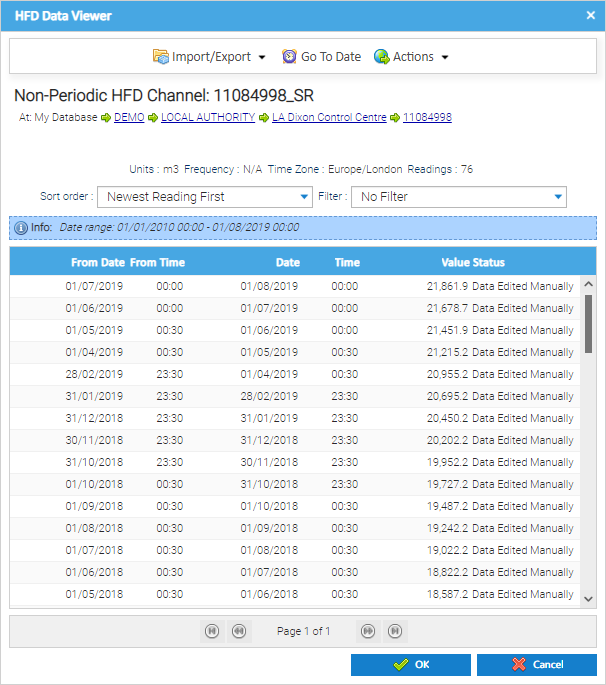
HFD Viewer
| Opens the HFD Data Viewer pop-up for the selected Channel in the list to see a record of all the data that has been loaded into the system for the Channel. Note HFD is an acronym for High Frequency Data.
|
Export to Excel
| Exports an Excel spreadsheet of the data in the section |


| Option | Description |
|---|---|
| New Periodic Channel | Allows a new periodic Channel to be created for the selected Meter. It will open up the Periodic Channel Editor pop-up so the relevant details for the asset can be entered. Click here for more details on Creating Meters and Channels (Periodic or Non Periodic) |
| New Non Periodic Channel | Allows a new Non Periodic Channel to be created for the selected Meter. It will open up the Non Periodic Channel Editor pop-up so the relevant details for the asset can be entered. Click here for more details on Creating Meters and Channels (Periodic or Non Periodic) |
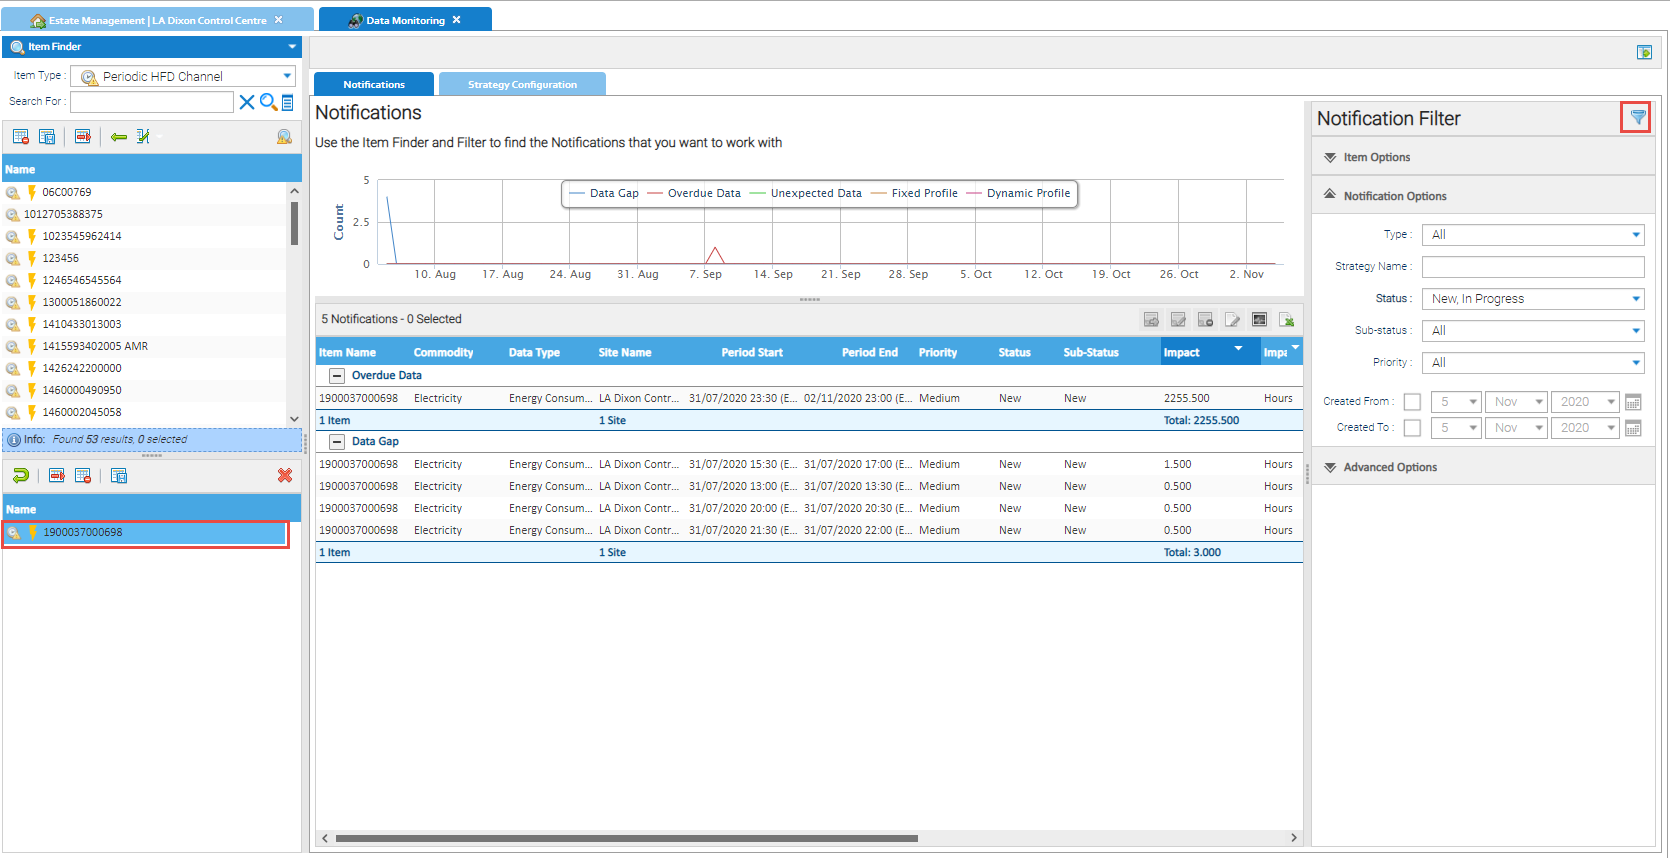
| Data Monitoring | Opens the Data Monitoring Activity. Click on the Channel in the bottom section of the Data Selector, then click refresh show any outstanding Notifications. Click here for more details on Data Monitoring.
|
Reporting | Opens up the Reporting Activity in the context of the Channel selected. |
Analysis
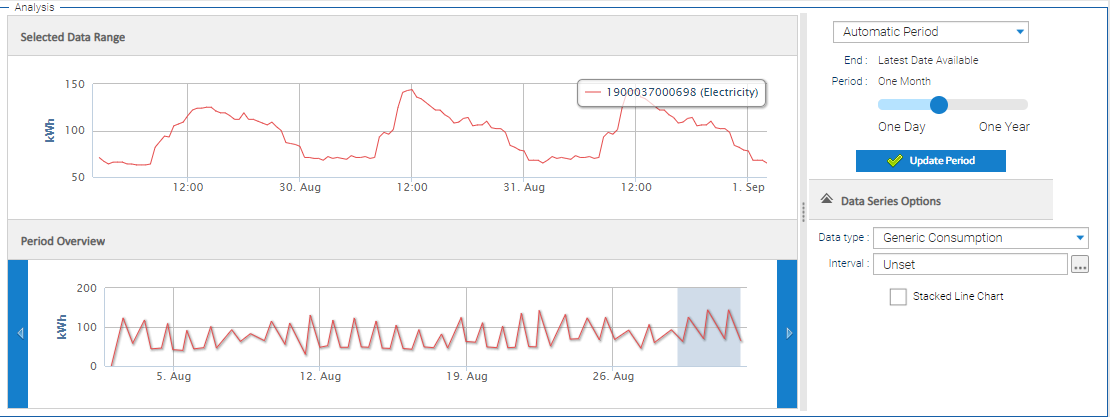
The Analysis section shows the most recent data for the selected Meter. This is the same capability that can be found in the Browsing Data Activity.
The default is to show 1 month of the latest data available, but this can be changed using the filtering options available on the right hand side for up to one year or a specific period.
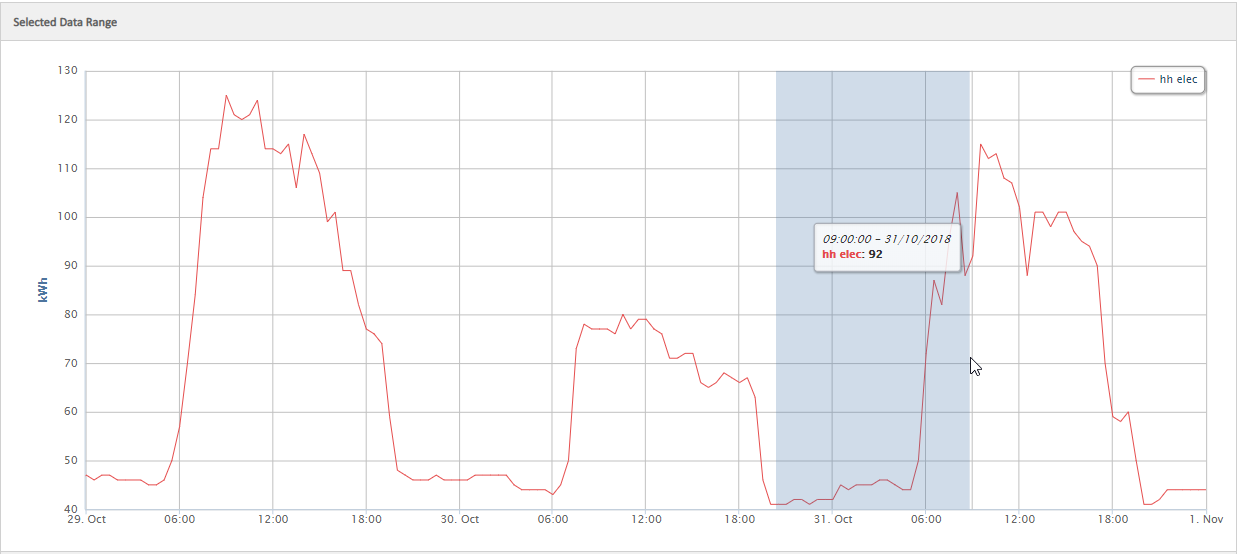
Selected Data Range Section
When the items have been selected the Selected Date Range window will be populated.
The window will automatically find the most recent month of data to display. If multiple Items are selected the main window will display based on the Item that has the most recent data.
You can zoom in on the Selected Date Range by clicking on the graph and drag to the area you want to see in more detail.
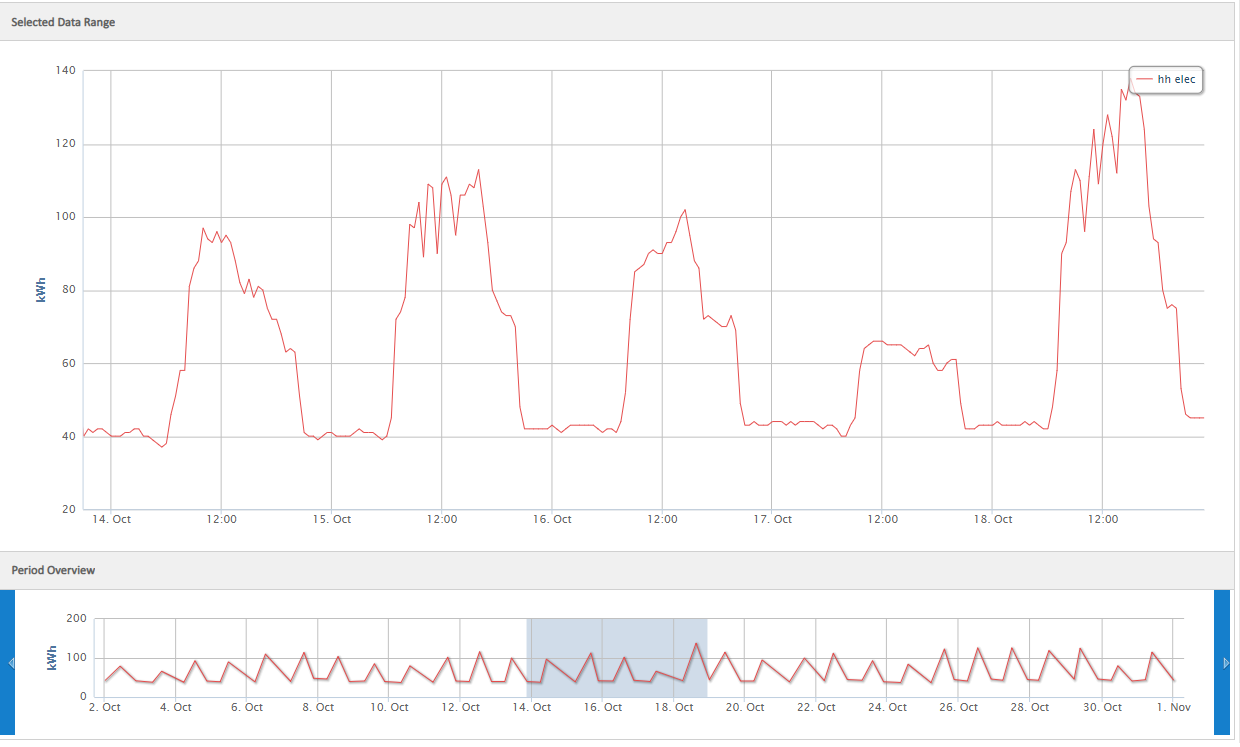
Period Overview Section
The Period Overview window highlights the date range that is being displayed in the Selected Data Range above.
To change the period, click on the period you want to view and drag the mouse across to the required range.
Period Selection
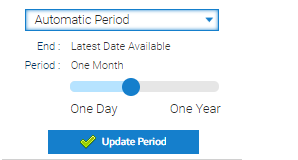
Allows you to set the period you want to analyse:
- Automatic Period - will return the latest data for the selected item
- Period - use the slider to change from between one day and one year. This is the length of time that data is returned from counting backwards from the latest date that data is available for. The default is one month
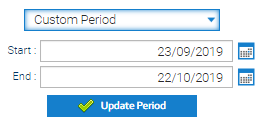
- Custom Period - allows you to enter specific start and end dates to only show the data between those dates.
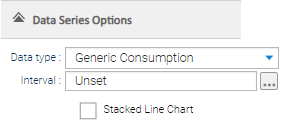
Data Series Options
Generic Consumption
Allows you to to display the consumption data:
- Data Type – change to Generic Consumption
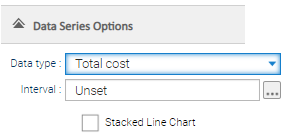
Costs
Allows you to to display the consumption data by cost:
- Data Type – change to Total Cost
Note: To use costs for Metering data, you will need to have a Cost Definition set up at Site Level, and then the Cost Definition linked to a Meter. The Cost Definition must only have one rate, using the 'All Day' Register and be set up under the Site.
Note: You must also select the Periodic Channel, not the Meter.
- Choose Total Cost and the graph changes to show the cost for the period
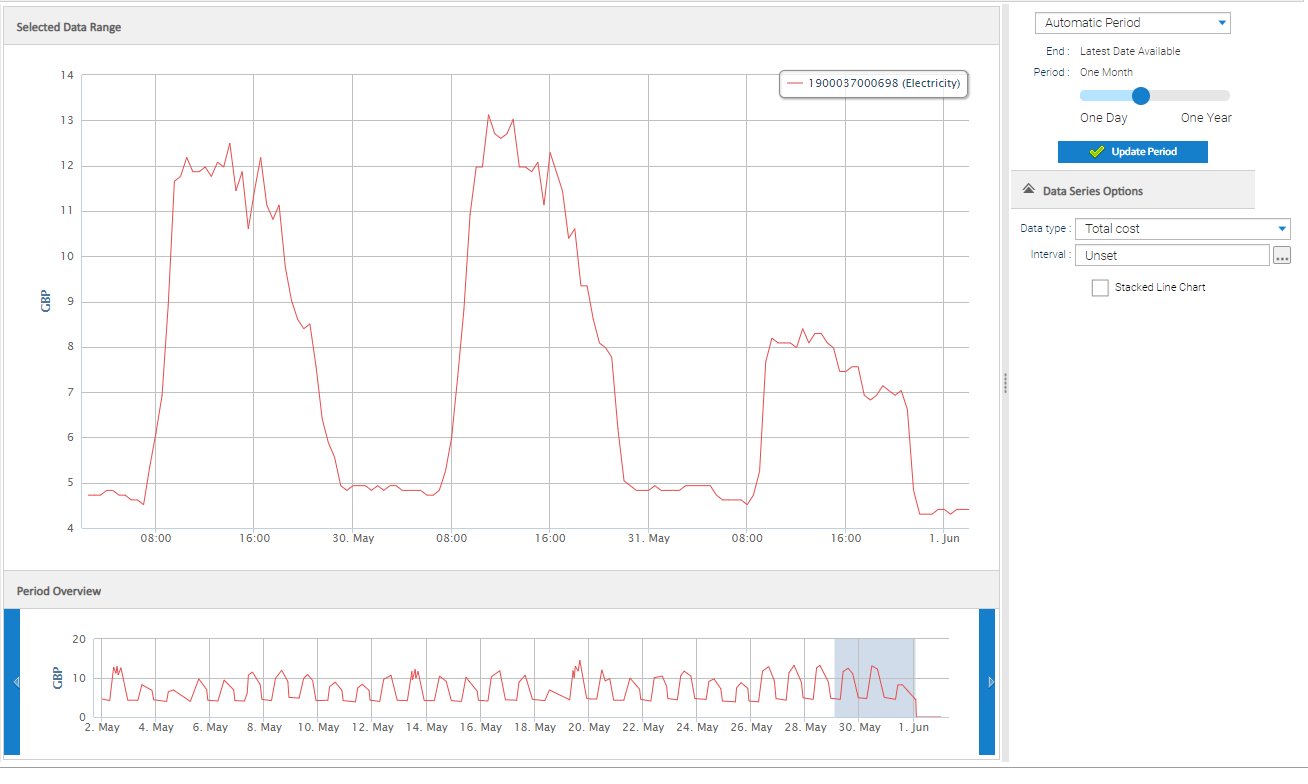
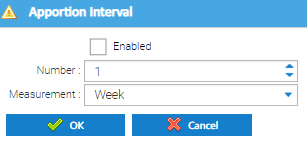
- Interval – option to change the granularity that you want the chart to be presented in (i.e. apportion or aggregate into specific chunks of time)
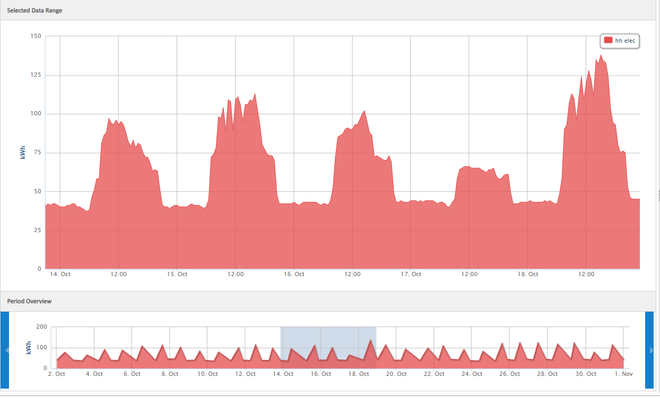
- Stacked Line Chart – allows you to turn the line chart into a stacked area chart where the area from the bottom of the axis to the data line will be filled.
Related Items
This section shows all the Items related to the selected Item (i.e. Supply Point, Account or Meter) and can be filtered to a particular period of time which represents the configuration and relationships in effect during that time.
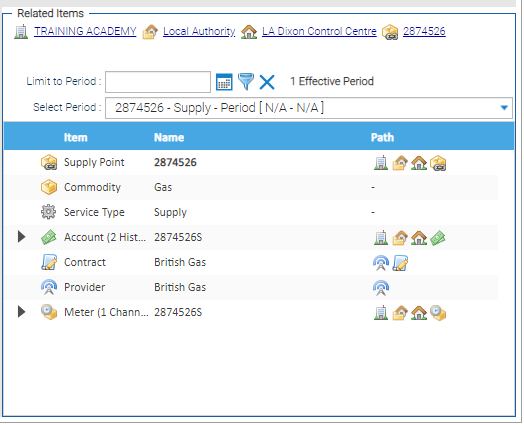
- Click on
 to see more details such as the previous Account Numbers (where there are historical changes to the account number) and the Channels associated with a Meter.
 - The "Path" icons are hyperlinks, which will allow easy access to the applicable screens to edit the selected item.
Options
| Option | Description |
|---|---|
| Breadcrumb | Hyperlinks you to the Items above in the database hierarchy, for example the path might be: Organisation → Site Group → Site → Item |
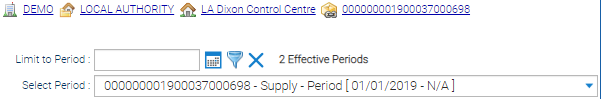
| Limit to Period | This allows a particular date to be selected to update the section to only show the relationships that were effective for the selected period of time. For example, you might want to know what was in effect on 01/01/2019, and selecting this date would allow you to see how the selected Item (Supply Point / Account Meter) was related to other items on that date. |
| Filter | Selecting the filter button will run the filter for the date entered and update the section to only show the effective relationships on that date. The screen will automatically select the appropriate period in the "Select period" drop-down list. |
| X | Selecting the blue cross will clear any dates that have been entered in the "Limit to Period" field. |
| Select Period | Use the drop down list to select the required Contract period. It will display a row for each discrete period of time that the relationships were active. Where no date has been entered in the Limit to Period field, this will show a list of all the different contract periods that exist for the selected item. |
Related content
@ Copyright TEAM - Energy Auditing Agency Limited Registered Number 1916768 Website: www.teamenergy.com Telephone: +44 (0)1908 690018