Sigma Online User Manual
Browsing Data
- Graham Paul
- Kim Blake
- Tom Anderton
Introduction
The Browsing Data activity allows you to graphically analyse and interrogate the data from your sites.
The Activity is best used to show the data from your Periodic Channels. However, if you have added a Cost Definition to the Site (and linked it to a Meter), you can can view the data as cost rather than consumption.
Note: The Cost Definition needs to show one rate only in order for the costs to show in Browsing Data.
Opening the Browsing Data activity
- Click on Browsing Data from the Welcome page.

Analysis Options Menu
- Check that the Change Analysis View shows Browsing Data.

Selecting Items to browse
- Select an Item(s) to browse from the left-hand window. For example, select Site, Meter or Periodic Channel. If selecting Site, you can then choose which Items from the Site you want to view.
- If more than one Item is selected, you will see data from all Items in the overview.
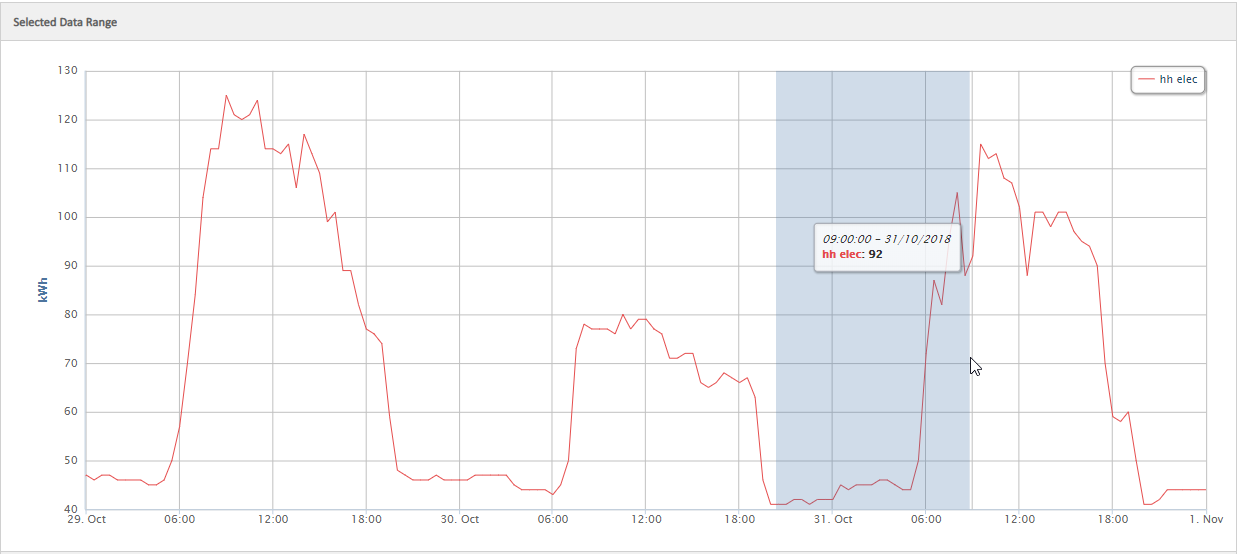
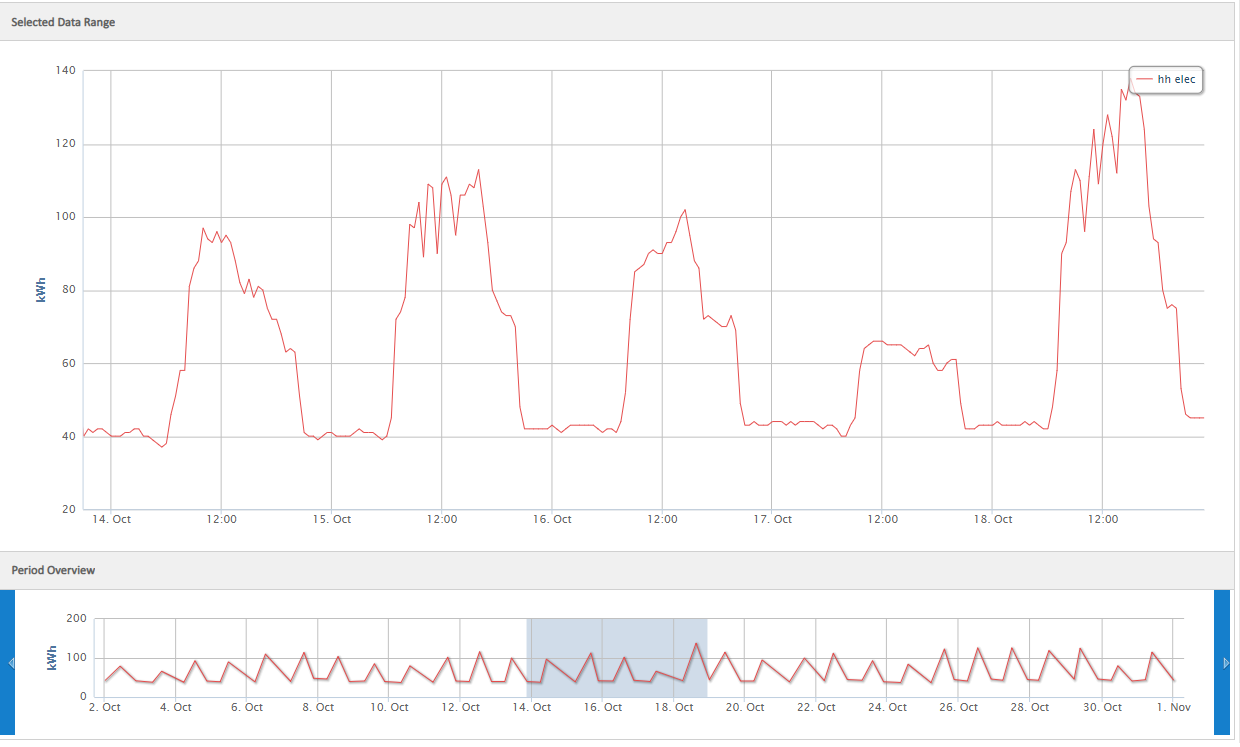
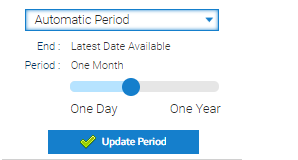
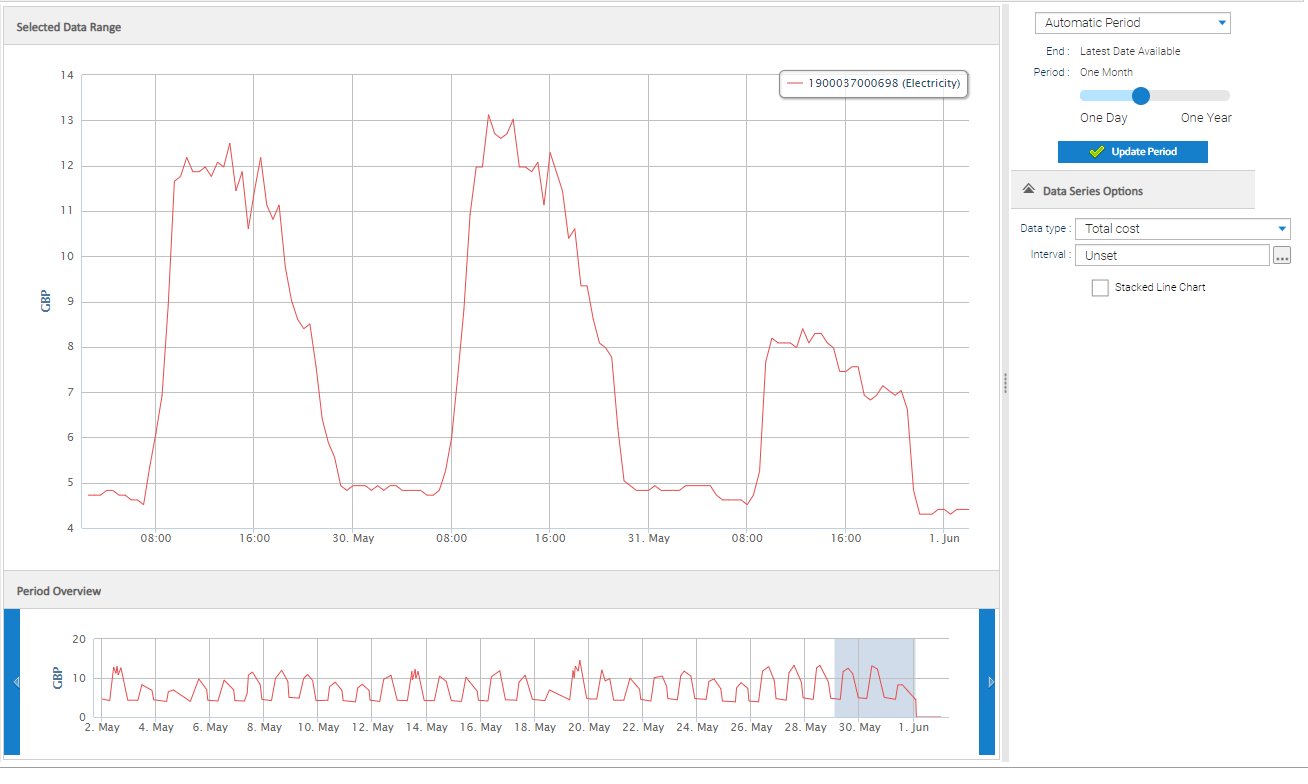
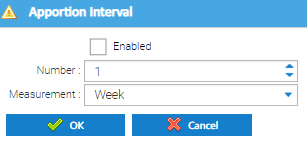
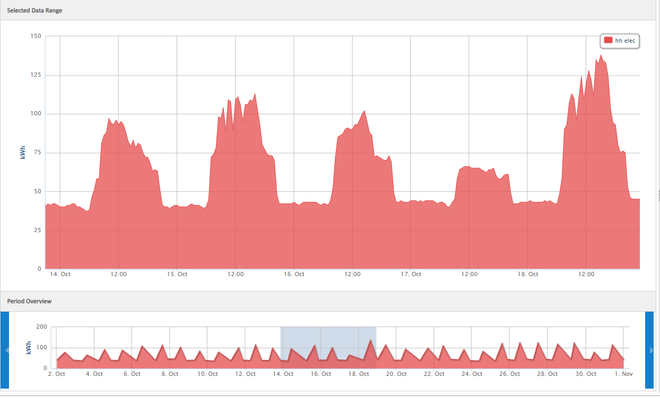
When the items have been selected the Selected Date Range window will be populated. The window will automatically find the most recent month of data to display. If multiple Items are selected the main window will display based on the Item that has the most recent data. You can zoom in on the Selected Date Range by clicking on the graph and drag to the area you want to see in more detail. The Period Overview window highlights the date range that is being displayed in the Selected Data Range above. To change the period, click on the period you want to view and drag the mouse across to the required range. Allows you to set the period you want to analyse: Allows you to to display the consumption data: Allows you to to display the consumption data by cost: Note: To use costs for Metering data, you will need to have a Cost Definition set up at Site Level, and then the Cost Definition linked to a Meter. The Cost Definition must only have one rate, using the 'All Day' Register and be set up under the Site. Note: You must also select the Periodic Channel, not the Meter. 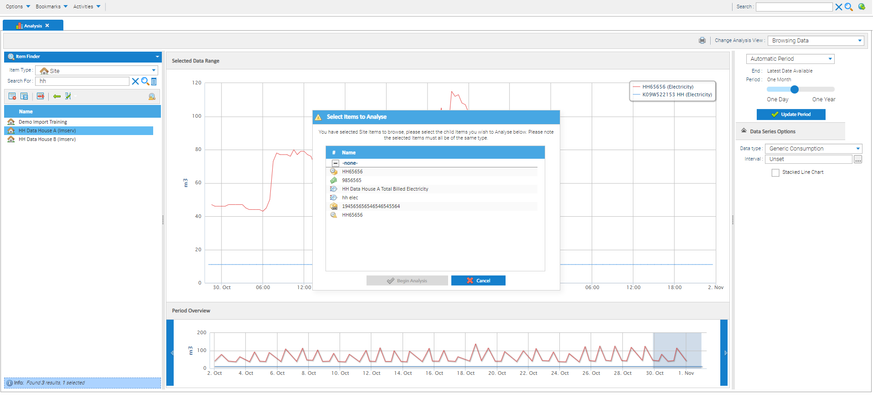
Selected Data Range Section
Period Overview Section
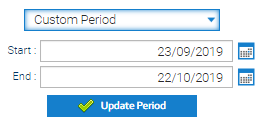
Period Selection
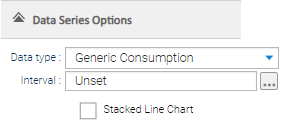
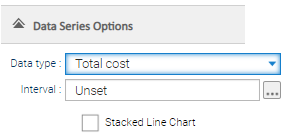
Data Series Options
Generic Consumption
Costs
Related content
@ Copyright TEAM - Energy Auditing Agency Limited Registered Number 1916768 Website: www.teamenergy.com Telephone: +44 (0)1908 690018