Sigma Online User Manual
Managing your Budget
- Kim Blake
- Graham Paul
The Budgets are created in the Budget Creation Activity. The Budget Management Activity allows you to view/manage the Budgets that have already been created.
Opening Budget Management
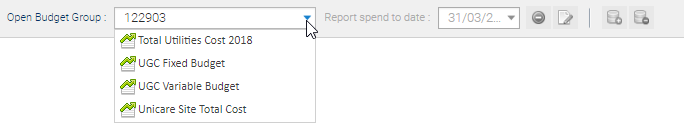
Click on the Budget Management Activity

Use the drop-down to open a Budget Group
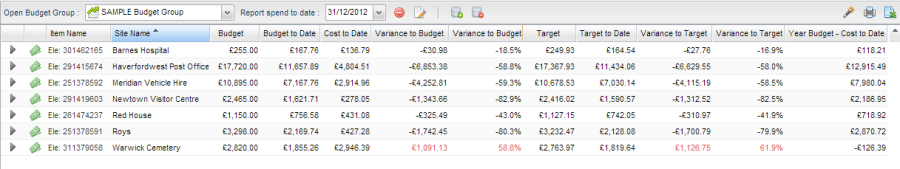
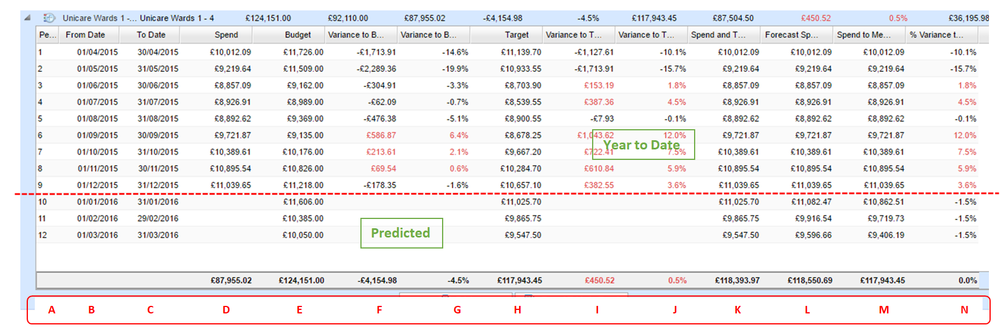
You will then be presented with a table detailing the budget/target costs to date as an absolute figure and their % variance.
The final column in the table details 'Year Budget – Cost to Date' which shows the amount of budget remaining.
Clicking on one of the arrows at the beginning of the row will provide you with the annual breakdown for that object.
Spend and Target
This will show the spent amount for each period up to the 'Report Spend to Date' selection.
After the Report spend to date it will display the target amount.
The reason for this column is to determine where we are going if we are on target for the rest of the period
Forecast Spend on Current Trend
This will show the spent amount for each period up to the 'Report Spend to Date' selection.
After the Report spend to date it will take the Total % of 'Variance to Target' and apply this to the unspent target.
The reason for this column is to determine where we are going if we continued the same deviation from target.
Spend to Meet Target
This will show the spent amount for each period up to the 'Report Spend to Date' selection.
After the Report spend to date it will take the Total 'Target' minus Total 'Spend'. This leaves the remaining target amount.
The remaining target amount is then applied according to the original target weightings to the unspent periods.
The reason for this column is to determine how much/little they have to spend in the remainder of the year to meet the original Total Target.
% Variance to Meet Target
The reason for this column is to show you in terms of % how much/little they need to save over the coming periods to meet the Target.
Individual monthly budgets or targets may be changed by double-clicking on the row and amending the figures.
Changes will be reflected in the headline figures displayed in the table when the detail screen is closed.
The buttons at the bottom enable you to either ![]() or export this information to Excel
or export this information to Excel ![]() .
.
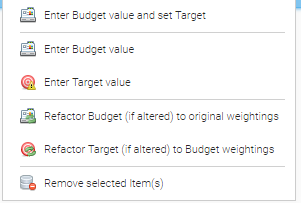
On the main table you have the following options when right-clicking a row within the table.
Explanation of a Budget
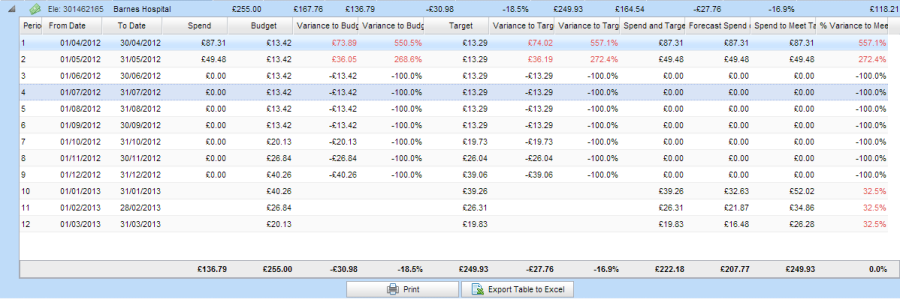
Click on the > next to a Budget to expand the view to see the individual figures for that Account or Monitoring Point
Letter | Column Header | Description |
|---|---|---|
| A | Period | The months in the Budget |
| B | From Date | We have used the 2015/16 Financial year |
| C | To Date | As above |
| D | Spend | (£87,955.02) What has been spent to date (April to December 2015) |
| E | Budget | (£124151) The total Finance Department have budgeted for the year for Gas, Electricity and Water. We have used the Total Utilities Cost Monitoring Points and the Budget is approximately the same as last years costs. |
| F | Variance to Budget | (-£4154.98) Year To Date figure. We haveunderspent(figure is a minus) by this amount compared to the Budget (ie rows 1 – 9 of column D (Spend) minus rows 1 – 9 of column E (Budget)). Rows 1 – 9 of Budget (column E, YTD) = £92110 minus rows 1 – 9 of Spend (column D, YTD) = £87955.02 equals £-4154.98 (column F) |
| G | Variance to Budget % | (-4.5%) Year To Date variance percentage, based on column F – a drop of 4.5% |
| H | Target | (£117943.45)- The total the Finance Department have given you as a Target – in this instance, 5% less than the Budget (column E). You can create a Target that is the same as the Budget if required, this would mean that your forecast would be against the same figures as your Target |
| I | Variance to Target | (£450.52) - YTD difference between the Spend and the Target (columns D and H), rows 1 – 9. We have overspent (in red) |
| J | Variance to Target % | (0.5%) –The percentage of variance based on column I. We have overspent by 0.5% |
| K | Spend and Target | (£11839.97)- This is the sum of the YTD spend plus the remaining target. The first 9 rows are the same as column D (Spend), the last 3 rows re the same a column H (Target) |
| L | Forecast Spend on Current Trend | (£118550.69) - If you continue with your current spend, Sigma predicts this will be our annual spend (which works out at 0.5% spend on Target – column J). This is made up of the first 9 months (rows 1 – 9) of actual spend (column D), and the last 3 rows (rows 10 – 12) predicted spend based on the previous 9 months |
| M | Spend to Meet Target | (£117943.46) - The total is the same as the Target (column H). It uses the actual spend from rows 1 – 9 (same as column D), then predicts what the spend would need to be for the last three months so that you meet your Target (column H) |
| N | % Variance to Meet Target | (0%) - The total will always be 0, but look at rows 10 – 12 (the remainder of the financial year). This is the percentage that you will need to spend (or save) in order to meet Target. Ours shows 1.5% reduction on Target (column H) each month, ie we need to underspend by 1.5% for the next three months to meet Target |
Look at line 10 (January). The Spend to meet Target (column M) is £10862.15 and the Target (column H) is £11025.70. £10862.15 is 1.5% lower than £11025.70


| Option | Description |
|---|---|
| Use the dropdown to move between Budgets |
| Use the dropdown to move between dates in a Budget |
 | Click to delete a Budget Group |
| Click to Edit the Budget Group name or the tax options (change to display including or excluding VAT) |
| Click to add Budgets from the Data Selector |
| Click to remove the Budget from the Group (Highlight the Account or Monitoring Point) |
| Launch the Budget Import Wizard (using when creating a Budget) |
| Prints what you see on screen |
| Sends the Budget Group to Excel |


Related content
@ Copyright TEAM - Energy Auditing Agency Limited Registered Number 1916768 Website: www.teamenergy.com Telephone: +44 (0)1908 690018