Sigma Online User Manual
Budget Reporting
- Kim Blake
If you have created a Budget and used Monitoring Points or Accounts, there is a report called Budgeting that can be run in the Reporting Activity.
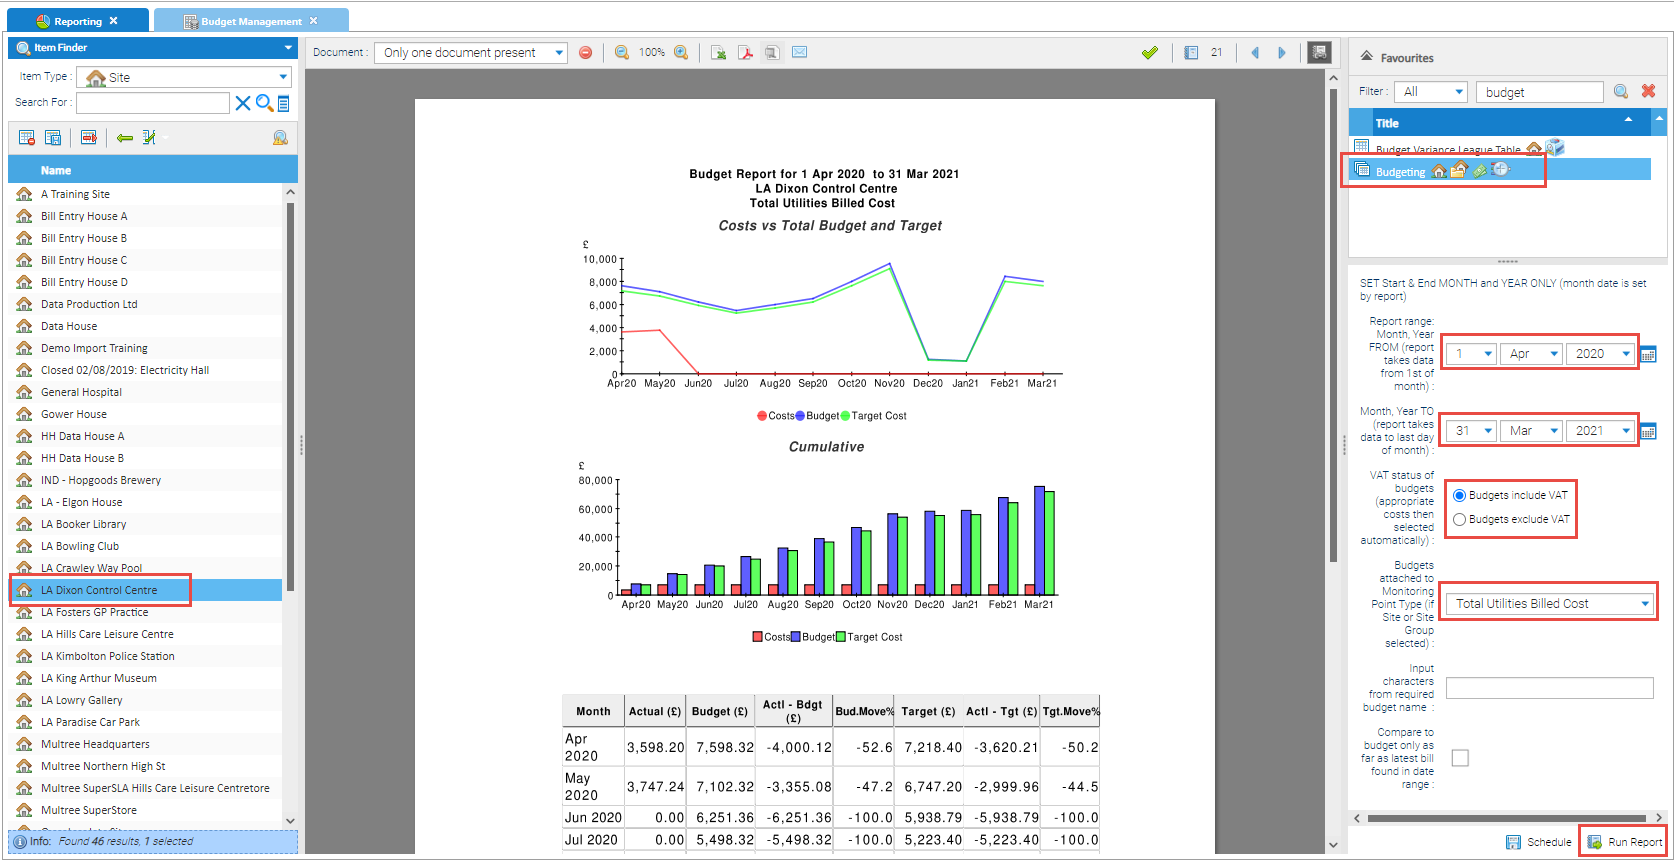
The Report produces a graph, cumulative graph and table depicting variance of monthly budgets vs actual costs over a selected period. This requires a Monthly Budget to be configured using Accounts or Monitoring Points.
See below for details on how to run the report:
Creating the Budget
Use the Budgeting pages to understand how to create the Budget, using the Budget Creation and Budget Management Activities.
Creating the Budgeting Report
The Report is created in the Reporting Activity.
- Open the Reporting Activity
- Choose the Accounts or Sites (with Sites you will also need to choose the Monitoring Point in the Report criteria) you want to run the Report on
- For each Account or Site, you will get a separate Report
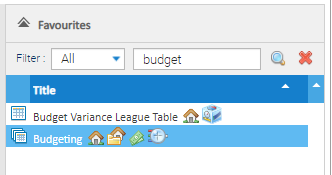
- Choose Budgeting from the Report selection
- Choose the Report template
- the below example is the Graphs plus table template
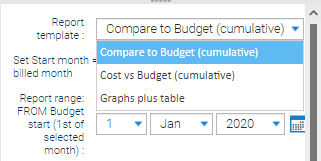
- Select the Report Range of the Budget you have created, ie 1st April 2020 to 31st March 2020
- Choose Budgets include or exclude VAT
- If using the Site, choose the Monitoring Point you have added to your Budget
- Input characters from required budget name : (leave blank)
- Tick Compare to budget only as latest bill found in date range (if required)
- Click Run Report
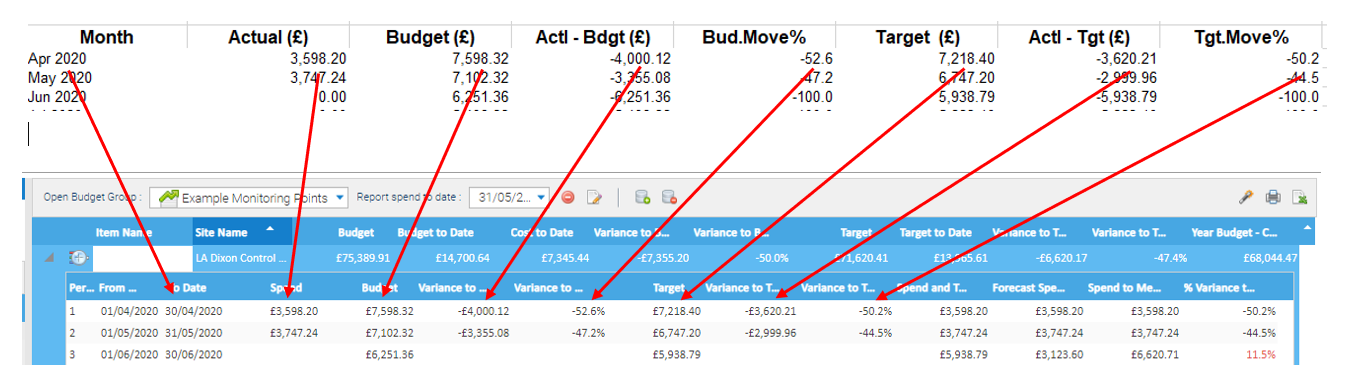
- The Budget Management Activity shows the same data:

- Comparing the Report and the Budget shows the same details:
Note, if you have chosen more than one Site or Account, this will produce separate reports, which can all be viewed from the Document
For more information on Reporting, click on the link.
@ Copyright TEAM - Energy Auditing Agency Limited Registered Number 1916768 Website: www.teamenergy.com Telephone: +44 (0)1908 690018