Sigma Online User Manual
Performance Overview
- Graham Paul
- Kim Blake
Introduction
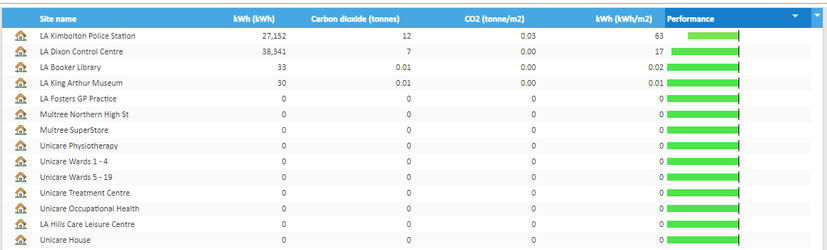
The Performance Overview provides a table of data for all of the sites comparing them and has options to show the best/worst performing sites.
Opening the Performance Overview Activity
Click on Performance Overview

Configuration Settings
To show any data other than consumption in your Performance Overview you need to setup Floor Area, Population (occupants) and/or Emission Factors within your database.
- Emissions factors are added underneath each Commodity – it is best to create these using the Tree Selector.
- Floor Area and Population should be created underneath each Site as an Associated Data Channels. Once the Channel has been created, the start date and figure needs to be entered, bearing in mind it means that the floor area was xx from this date.
Performance Score – How it's calculated, what it means
Benchmark figures
The Performance Overview benchmark categories and values are hard-coded into the software, taken from the TM 46 (2008) documentation. These values are statistically derived from sets of building data and normalised to a single representative benchmark value with due regard to Degree Day and Occupancy variations. The benchmark is the sum of electricity and thermal fossil fuel energy per square metre per year for the site category.
The Sigma Browser Interface currently calculates a raw energy per square metre per year figure for a site, unrelated to degree days or occupancy, and measures this against the TM 46 benchmark.
Measurement of 'Performance'
If the sum of the raw figure in Sigma of electricity and thermal fossil fuel energy per square metre per year for a site equals its category benchmark (e.g. for Hotel, General Office, Clinic) then the 'Performance' column displays a central black vertical line only – i.e. no deviation from perfection, otherwise shown to either side as a colour strip. The extent of good performance is shown as a green, or a red if poor strip to either side of the central marker in the performance column. If the performance results in a short stub slightly either side of the central 0% deviation point, then the colour is orange if slightly poorer, or yellow if slightly better than benchmark.
The maximum extent of the bar to the left (=half the defined column width), in green, would indicate 100% better than the benchmark – that is zero kWh/m2 per year, and red to the right, 100% worse, that is, twice the benchmark, which is the maximum degree displayed, with other values in between.
For example, if the benchmark figure for a particular category of site is 200 kWh/m2/yr and the sites performance is 50 kWh/m2/yr then it would extend 75% of the way to the left of the central bar, being ¾ of the way towards the potential minimum figure of zero. If the site performance was 320 kWh/m2/yr it would extend 60% of the maximum possible extent to the right, being 120 up on 200, where 400 kWh/m2/yr represents 100% worse.
The coloured bar is thus a rough guide to the sites performance compared to the benchmark.
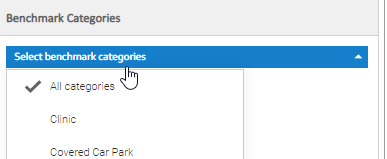
Benchmark Categories Filter
This allows you to Group by category. You can show individual categories such as Emergency Services or choose All categories to display all.
Click on Benchmark Categories
Tick/untick the categories you want to display
If you are on All categories, you can then group by category
Tick Group by category
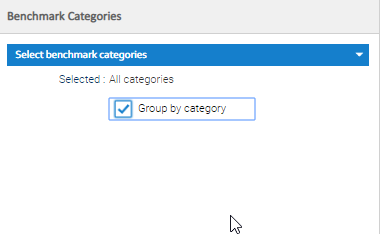
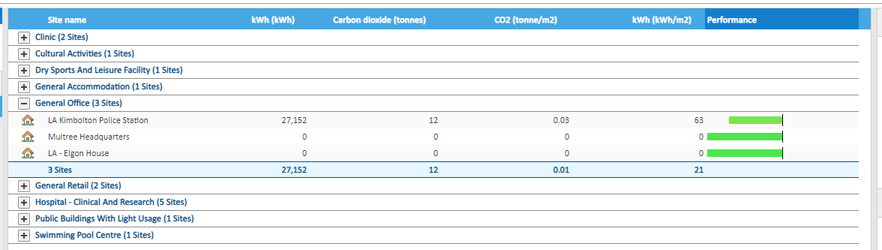
The screen will refresh to show Sites by Benchmark Category
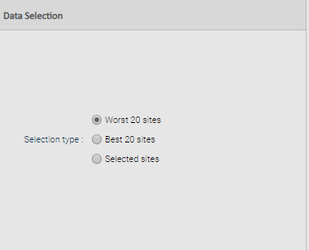
Data Selection
The table has three options. Select one of these particularly when using a large database as it gives a quick overview.
Worst 20 Sites – looks at any Site that has a Benchmark category
Best 20 sites – looks at any Site that has a Benchmark category
Selected Sites – Show sites currently selected in the Data Selector
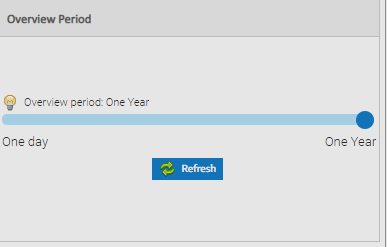
Overview Period
The default period for the overview table is set to one year. This can be changed for periods between one day and one year.
Click on the selector and move up or down to increase/decrease the time period
Click Refresh
Overview periods available are:
- One Day
- One Week
- One Month
- Six Months
- One Year
Right Click Options
There are five options when you right click on a Site in the main part of the Activity.
Assign to category - allows you to add a category to a site
Clear categories - removes the category from the Site
Site Overview - takes you to the Site Overview activity
Edit Site - allows you to view/edit Site details such as name, postcode, benchmark category or references
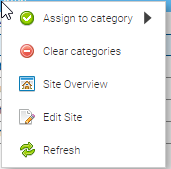
Refresh
The Refresh option will recalculate the data.
This is useful if you have entered new bills or readings and need the performance figure to update. This can be used on individual sites or when selecting sites in bulk.
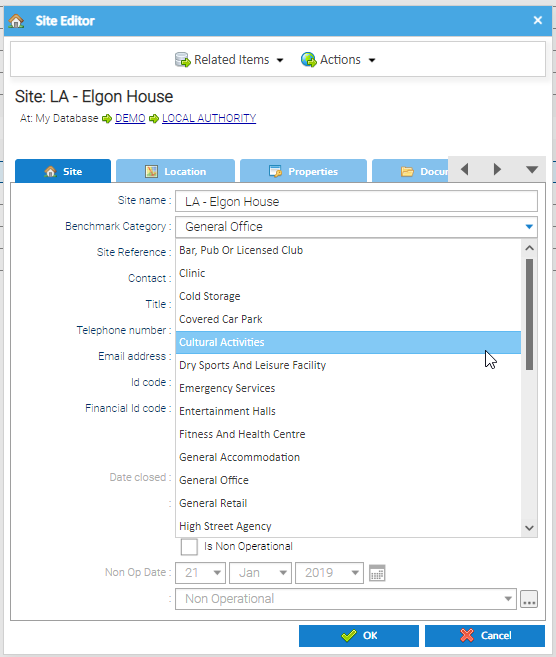
Assigning Categories to individual Sites
A category can be assigned to each site – one category per site.
From the Data Selector, right click on the Site
Click Edit
Choose the Benchmark Category from the dropdown list
Click OK
Related content
@ Copyright TEAM - Energy Auditing Agency Limited Registered Number 1916768 Website: www.teamenergy.com Telephone: +44 (0)1908 690018