Sigma Online User Manual
Site Summary Tab
- Tom Anderton
- Kim Blake
- Graham Paul
The Site Summary provides an overview of the Site, including details on how many Accounts, Supply Points, Meters and Channels (by type) are connected to the Site.
If you do not have these items in your database, click here for details on how to add Sites, Accounts, Meters, Channels and Contracts.
You can also access a focused view of the 'Tree Selector' and view a rolling 12 month view of the Month on Month trends for Cost or Consumption from each of the Billing Accounts on the Site.
The screen is divided into 3 sections:
Opening the Site Summary Tab
- Open the Estate Management Activity.
- Highlight a Site in the Data Selector to see the Site Summary Tab.
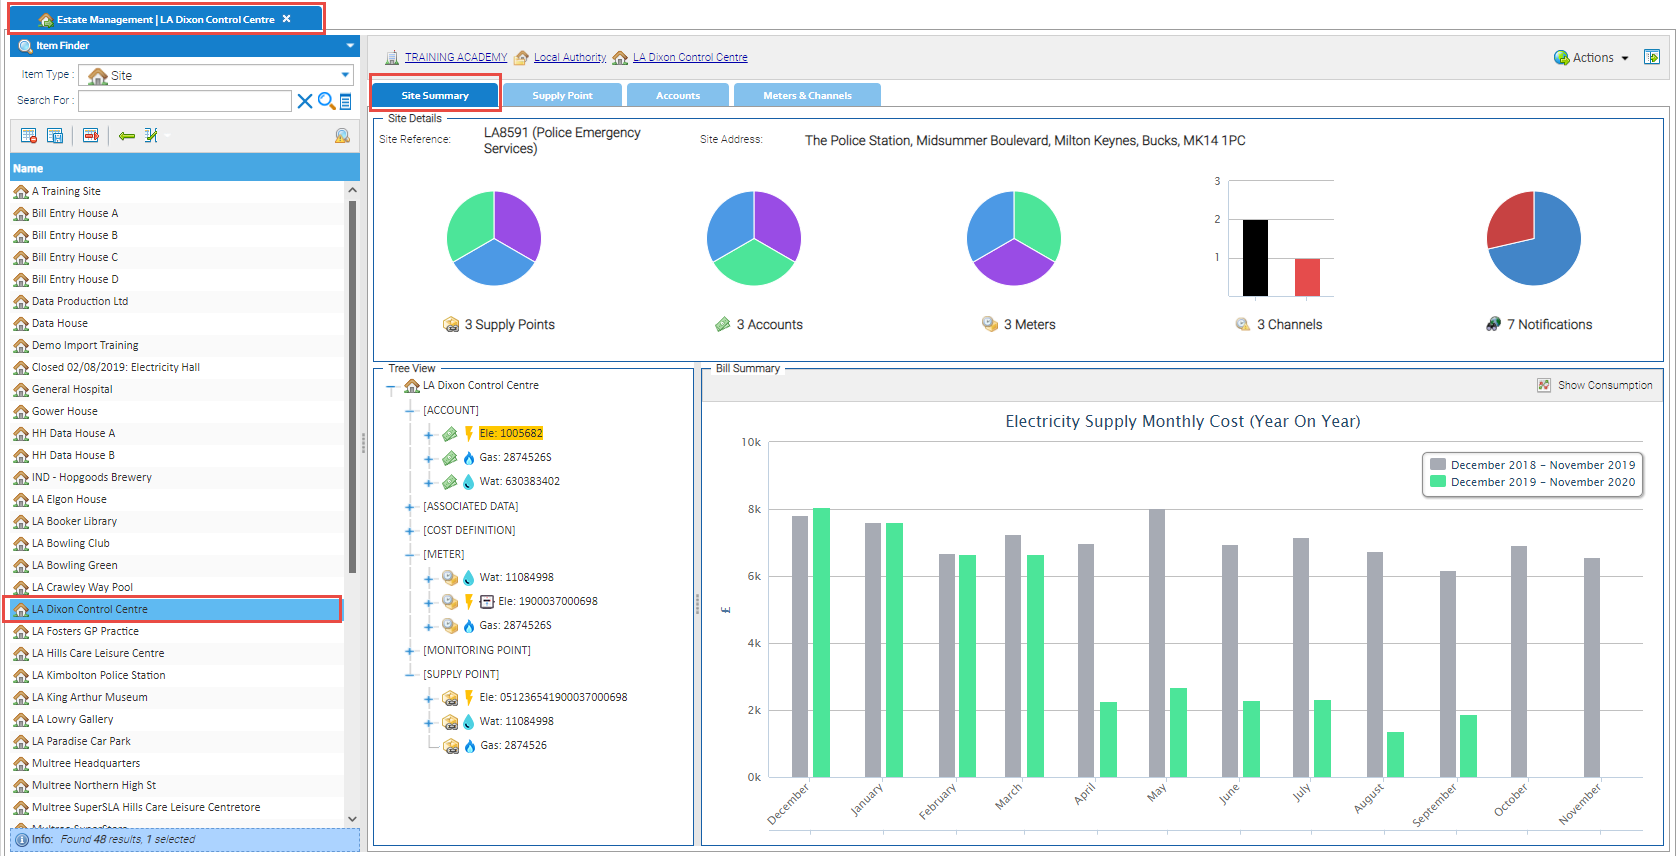
Site Details Section
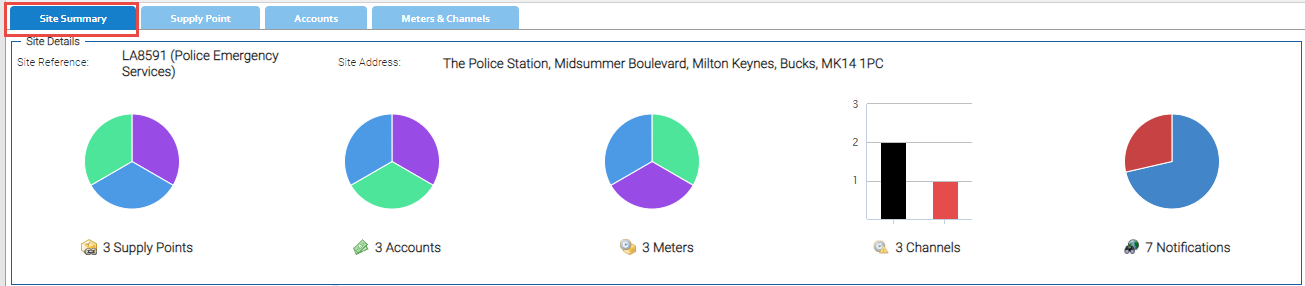
This details :
- The Site Reference
- The Site Address
- Three Individual Pie Charts showing:
- Accounts - by commodity
- Supply Points - by commodity
- Meters - by commodity
- A Bar Chart showing the count of any Periodic and Non Periodic Channels
- A Pie Chart of how many Data Monitoring Notifications are outstanding.
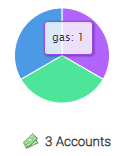
The colours used in the screen represent the different commodities.
- Green: Electricity
- Purple: Gas
- Blue: Water
Hovering over a Pie Chart/Graph will show the applicable number of Accounts for the Commodity:
To move to any other Tab, either click on the applicable Chart (e.g. clocking the Meters Pie Chart will open the "Meters and Channels" tab) or click on the Tab above the Site Details box.
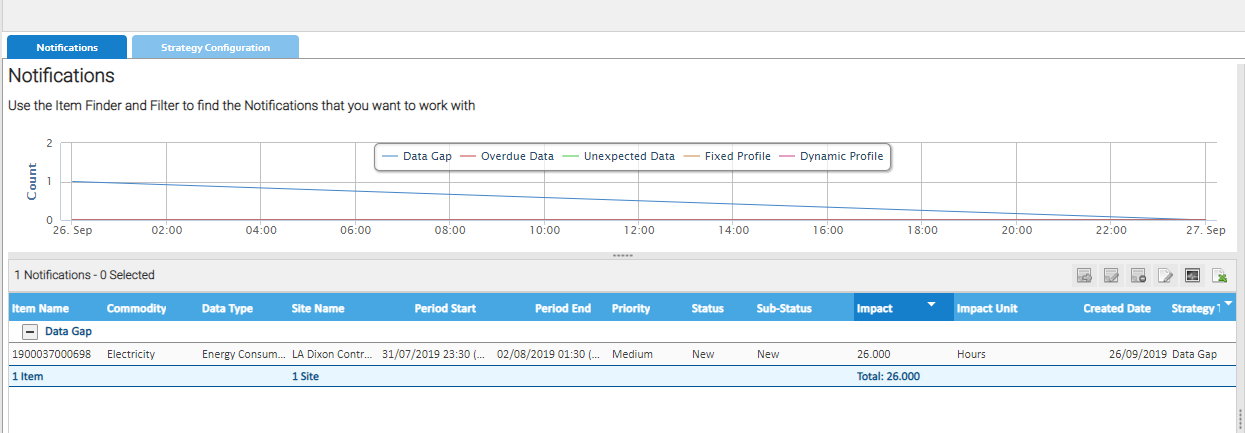
Clicking on the Notification Pie Chart will open the Data Monitoring Activity.
The Data Monitoring Activity will default to show the outstanding notifications for the selected Site
Tree View Section
The Tree View section will show a focused tree structure view for the selected Site only and will open the Account, Meter and Supply Point Items in the Tree.
The other Items on the Site will be visible, but will not be expanded by default.
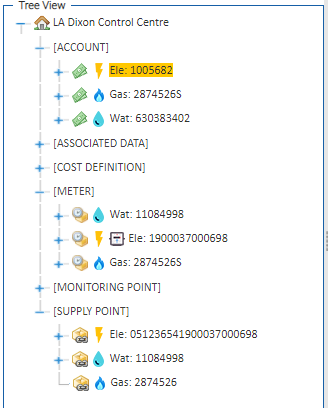
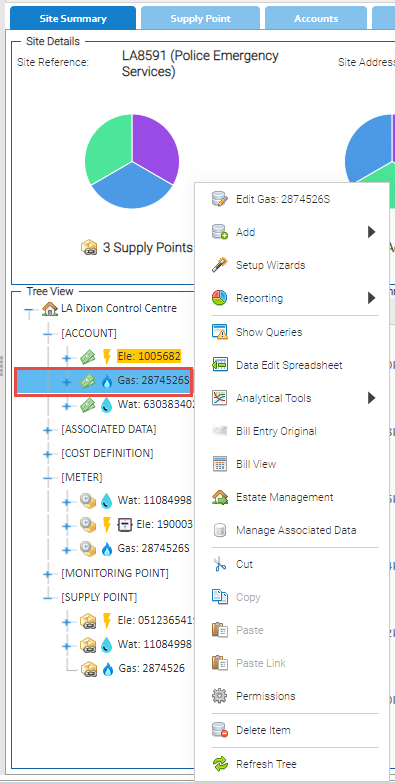
- Right click on any Item in the Tree Selector to see the standard options
Bill Summary Section
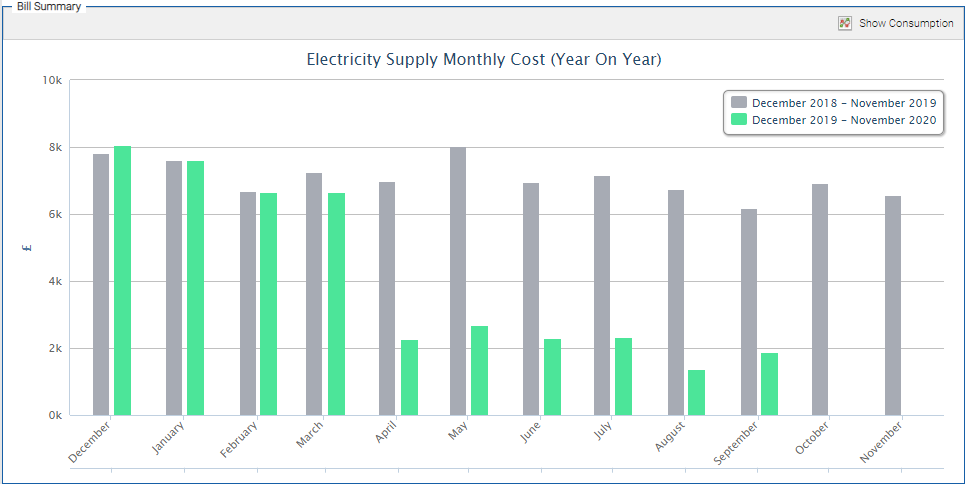
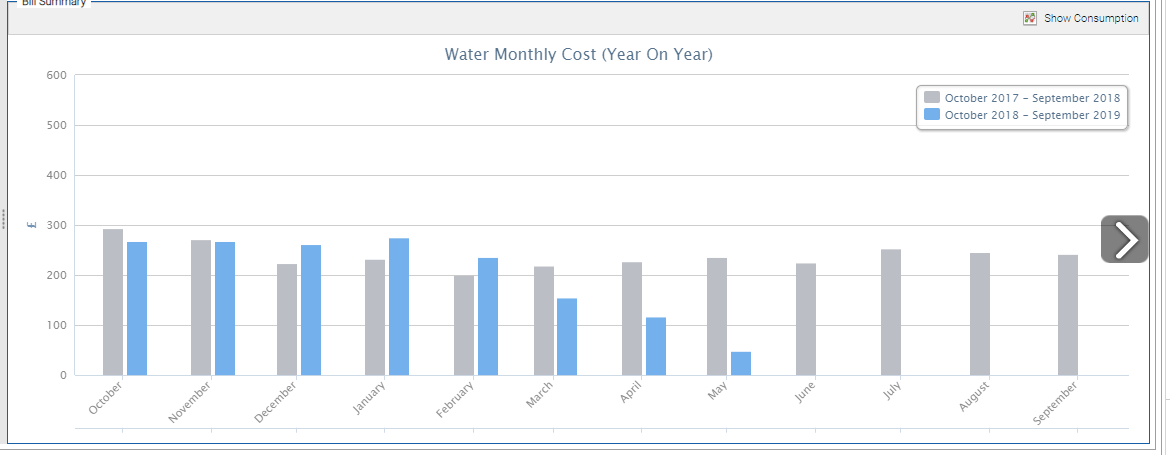
The Bill Summary will default to scroll through the Monthly Cost (Year on Year) for each Commodity, showing the current 12 months versus the previous 12 months. It is aggregating all the billing information (total net costs) for each account on the Site for the applicable commodity.
The coloured bar shows the latest years data for the applicable commodity, the light grey bar shows the equivalent month in the prior year.
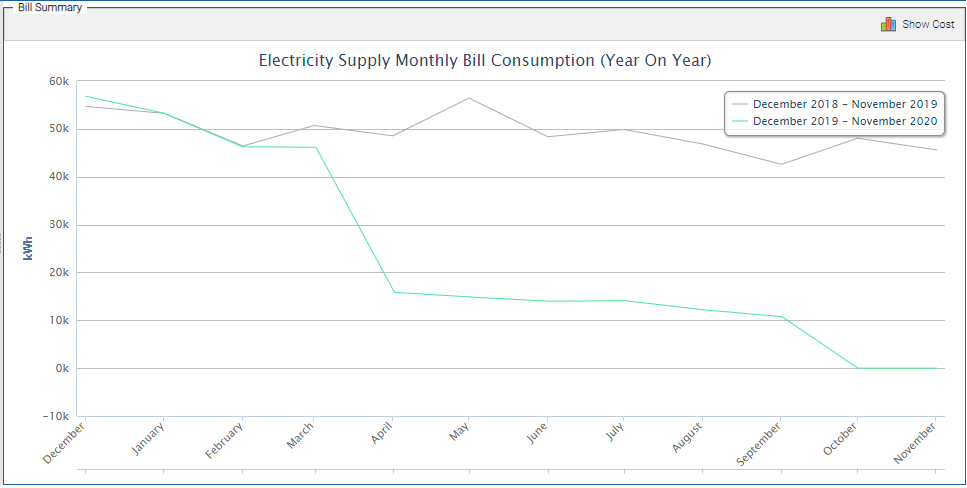
- Click the Show Consumption button to change the graph to show Monthly Consumption (Year on Year) for your Accounts, rather than cost information.
- Click Show Consumption again to change back to Monthly Cost (Year on Year).
Cost Example (Bar)
Consumption Example (Line)
To manually scroll through each of the Commodities for which Bills exist, hover over the right hand side of the chart and an arrow will appear:
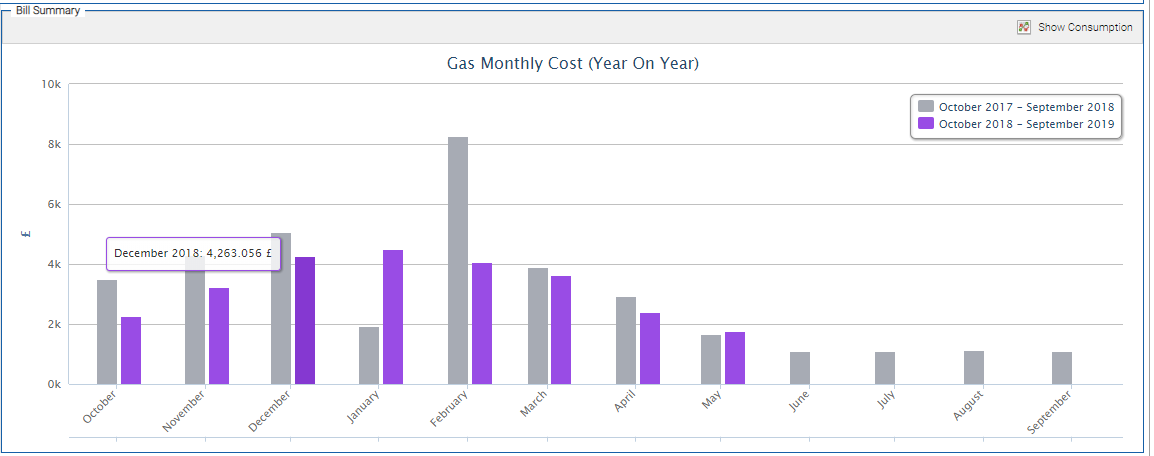
- Hover over a bar to see more detail:
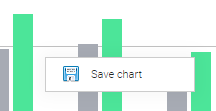
- Right click on the Graph to download a JPEG image of the chart on your local computer:
Related content
@ Copyright TEAM - Energy Auditing Agency Limited Registered Number 1916768 Website: www.teamenergy.com Telephone: +44 (0)1908 690018