Sigma Online User Manual
Bills - Daily Consumption Reports in EI
- Kim Blake
- Wendy Sagar
This page shows Reports that use the Bills Daily Consumption View. The first column has a link that will open the Report in Energy Intelligence.
Click on the link in the table to take you directly into the Report in Energy Intelligence in your own database.
Report Link - click on the link to log into Sigma and view the Report | Thumbnail | Report Description |
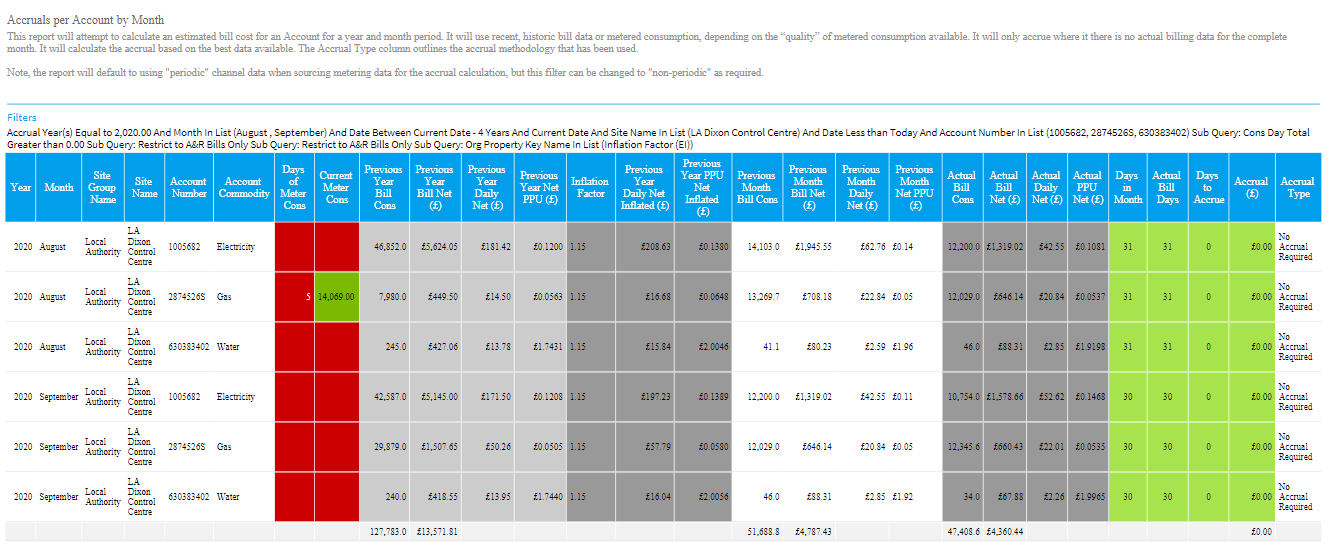
| Accruals per Account by MonthAttempts to calculate an estimated bill cost for an Account for a year and month period. It will use recent, historic bill data or metered consumption, depending on the “quality” of metered consumption available. It will only accrue where it there is no actual billing data for the complete month. It will calculate the accrual based on the best data available. The Accrual Type column outlines the accrual methodology that has been used. Click here for a detailed explanation of this report | |
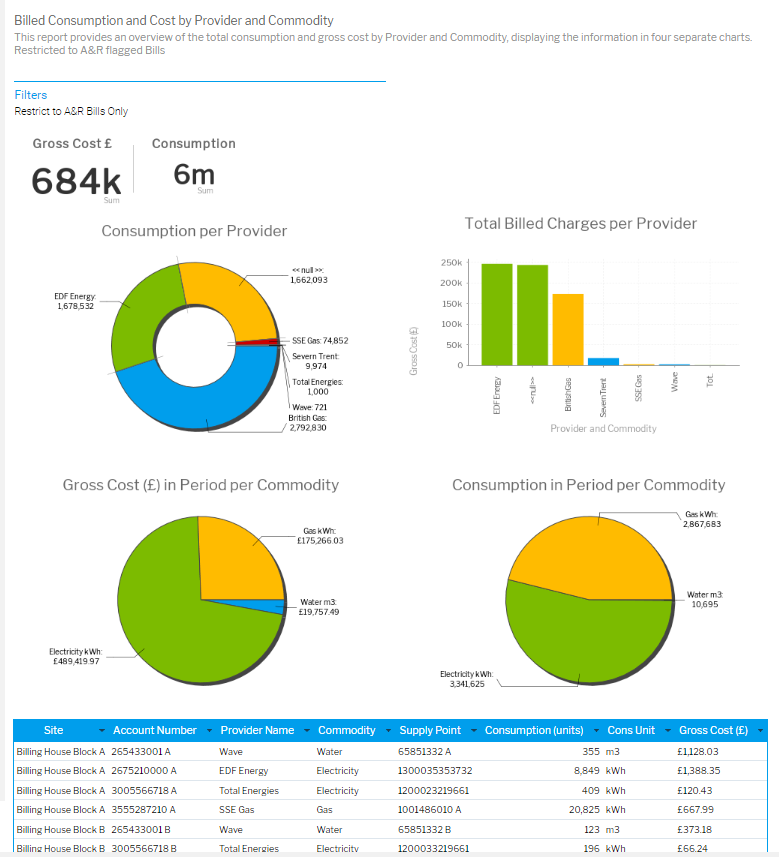
| Billed Consumption and Cost by Provider and Commodity Provides an overview of the total consumption and gross cost by Provider and Commodity, displaying the information in four separate charts. | |
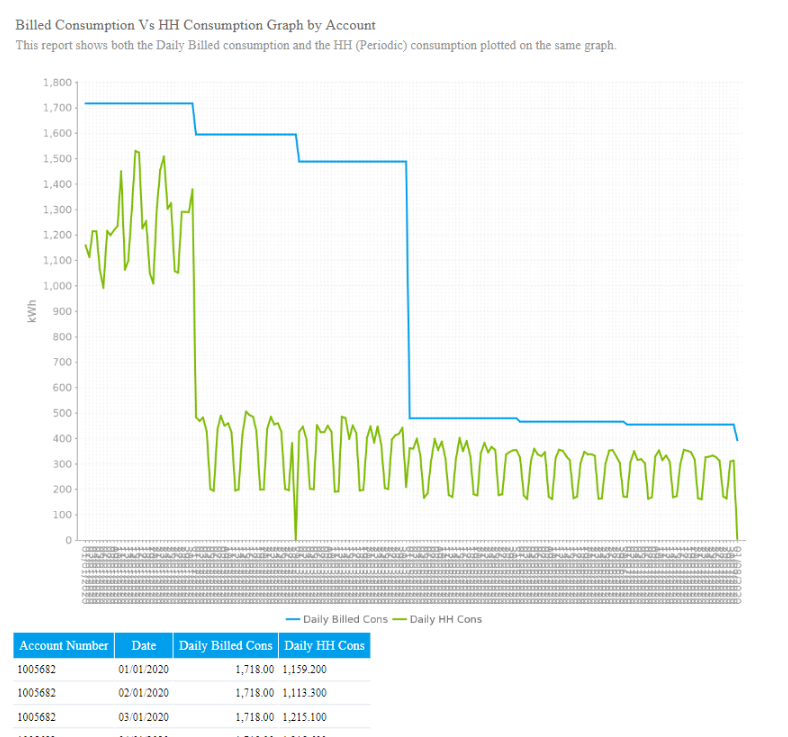
Bill Consumption Vs HH Consumption by Account |
| Billed Consumption and Cost by Provider and CommodityShows both the Daily Billed consumption AND the HH (Periodic) consumption plotted on the same graph. |
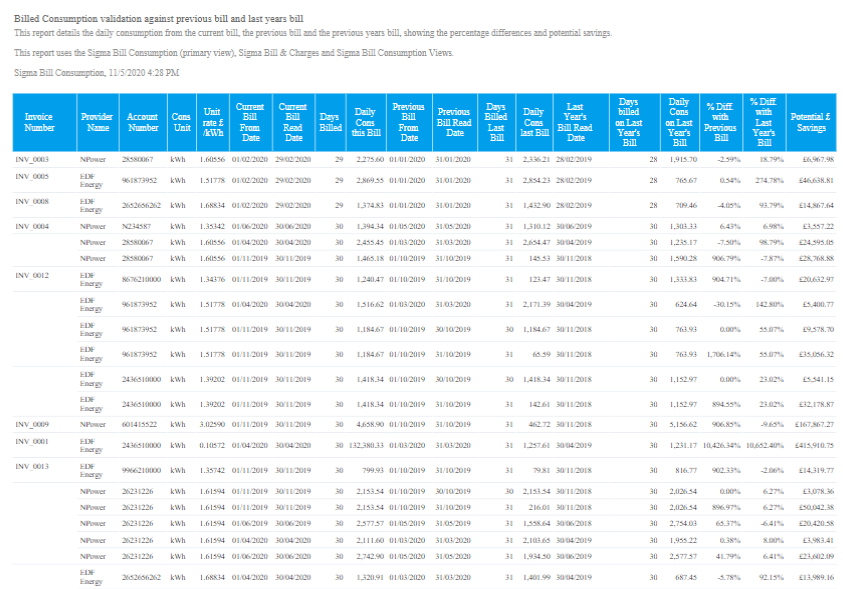
| Billed Consumption vs Previous bill and Last Years billDetails the daily consumption from the current bill, the previous bill and the previous years bill, showing the percentage differences and potential savings. Uses the Sigma Bill Consumption (primary view), Sigma Bill & Charges and Sigma Bill Consumption Views. | |
| Billed Cost, Consumption and Carbon Emissions |
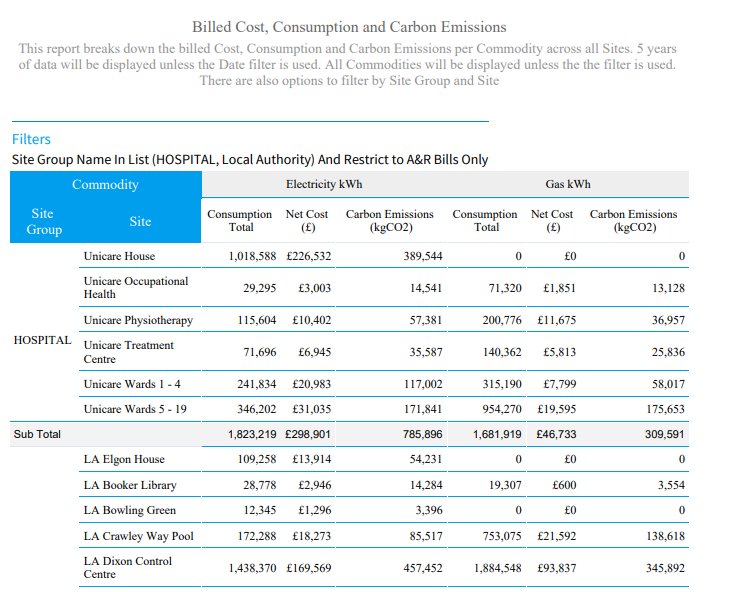
| Billed Cost, Consumption and Carbon EmissionsBreaks down the billed Cost, Consumption and Carbon Emissions per Commodity across all Sites. 5 years of data will be displayed unless the Date filter is used. All Commodities will be displayed unless the the filter is used. |
| Billed Cost, Consumption and CO2 by Commodity (Stacked bar chart) |
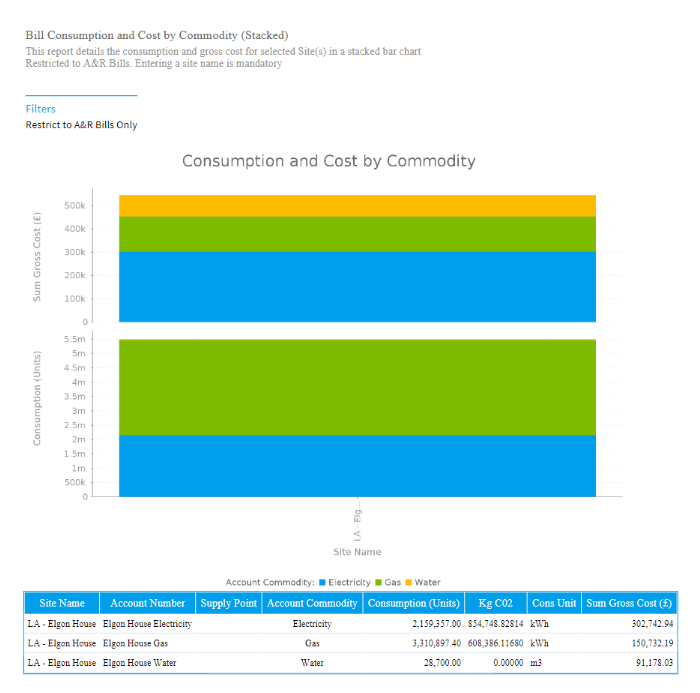
| Billed Cost, Consumption and CO2 by Commodity (Stacked bar chart)Details the consumption and gross cost for selected Site(s) in a stacked bar chart. |
Billed Cost per Commodity for the last Calendar Month |
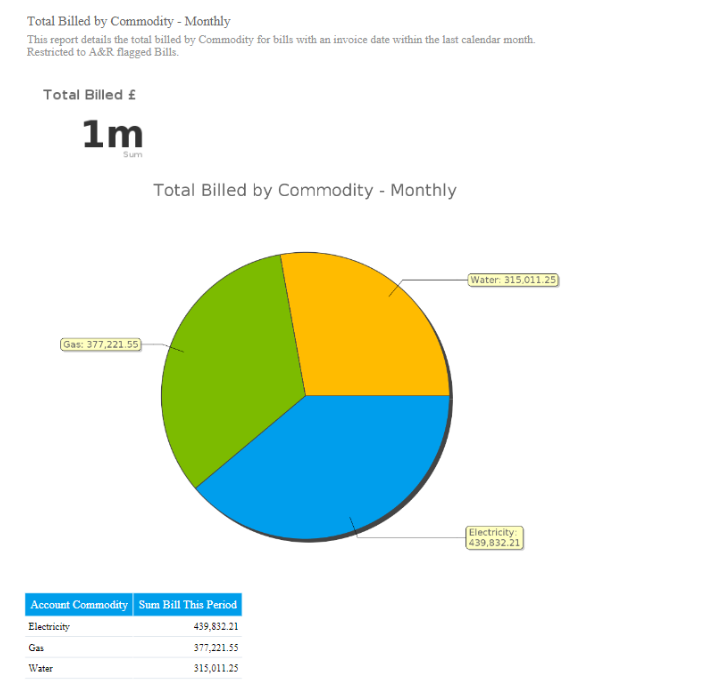
| Billed Cost per Commodity for the last Calendar Month |
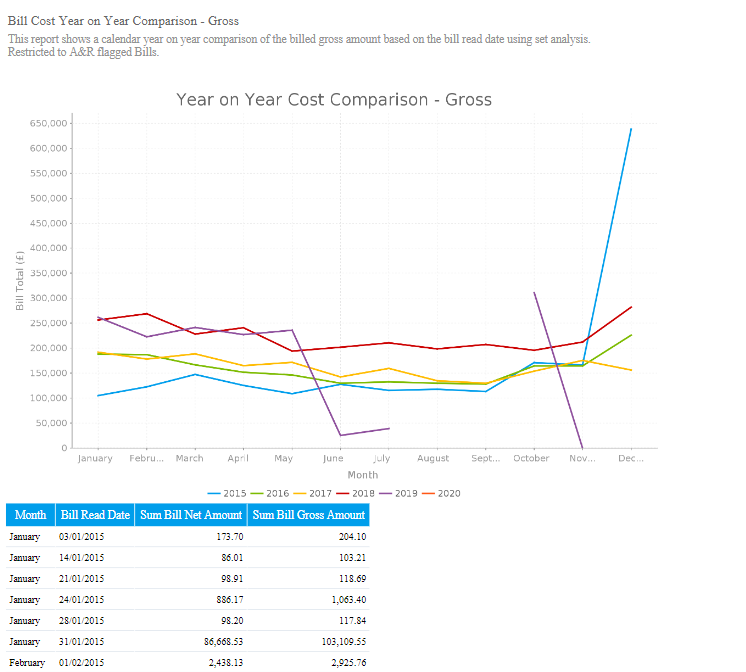
Billed Cost Year on Year Comparison |
| Billed Cost Year on Year ComparisonThis report shows a calendar year on year comparison of the billed gross amount based on the bill read date using set analysis. Click on a point on the graph or the Month Number in the tabular data to drill down to show the Weeks, then drill down further to view the daily data. |
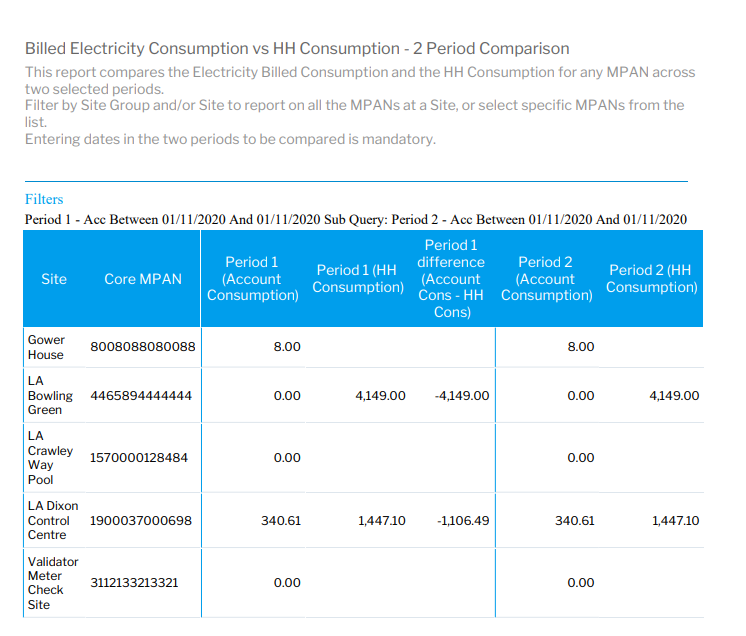
Billed Electricity Consumption vs HH Consumption - 2 Period Comparison |
| Billed Electricity Consumption vs HH Consumption - 2 Period Comparisontwo selected periods. |
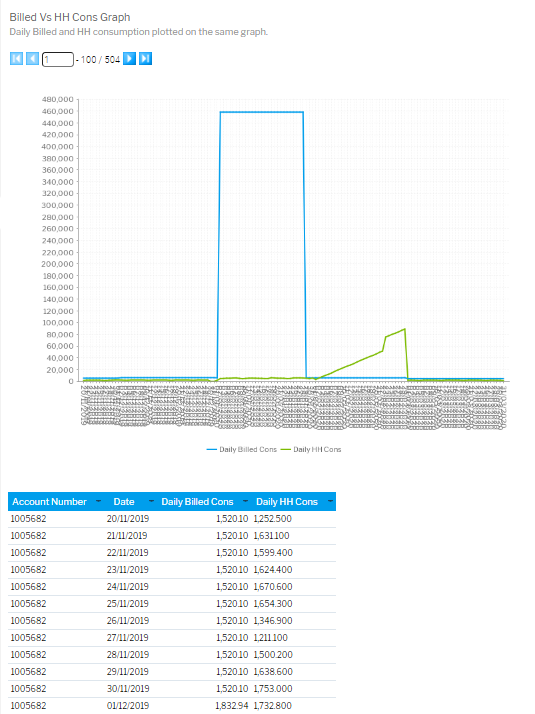
| Billed Vs HH Cons Graph |
| Billed Vs HH Cons GraphDaily Billed and HH consumption plotted on the same graph. |
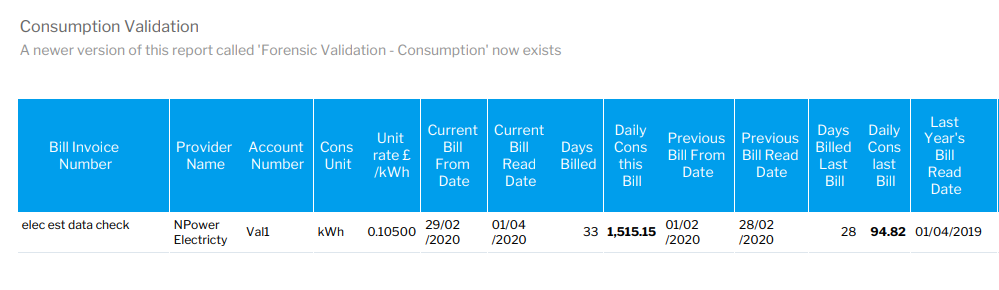
| Consumption Validation |
| Consumption ValidationA newer version of this report called 'Forensic Validation - Consumption' now exists |
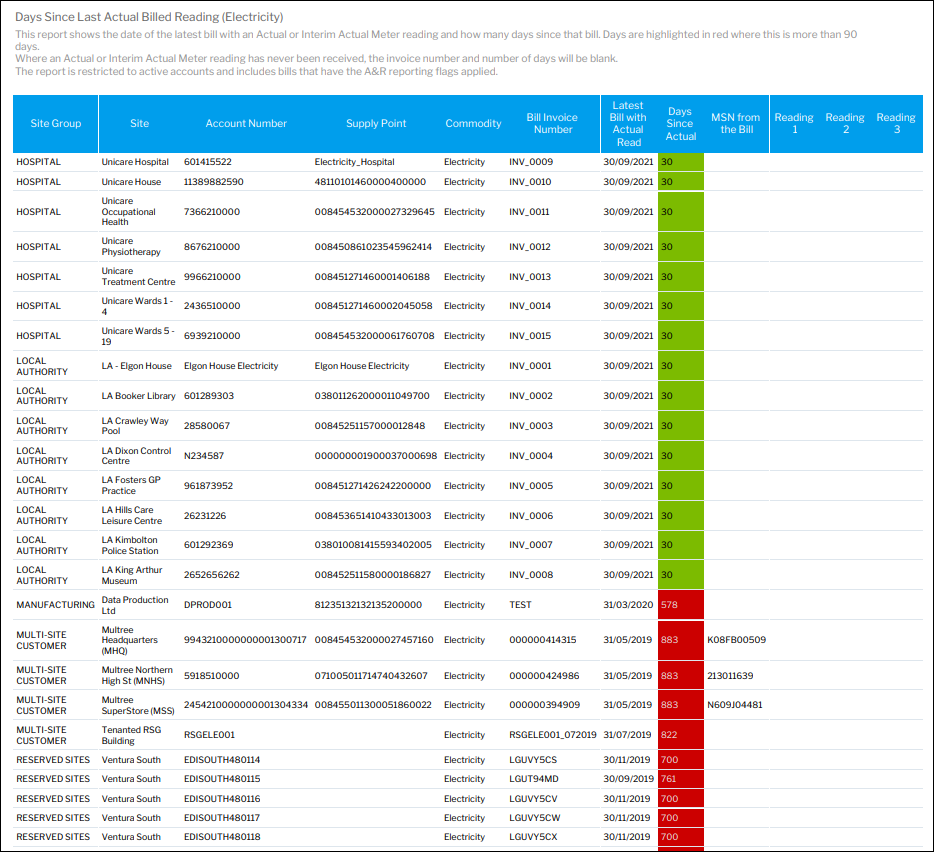
| Days Since Last Actual Billed Reading (Electricity) |
| Days Since Last Actual Billed Reading (Electricity)This report shows the date of the latest bill with an Actual or Interim Actual Meter reading and how many days since that bill. Days are highlighted in red where this is more than 90 days. Where an Actual or Interim Actual Meter reading has never been received, the invoice number and number of days will be blank. The report is restricted to active accounts and includes bills that have the A&R reporting flags applied. |
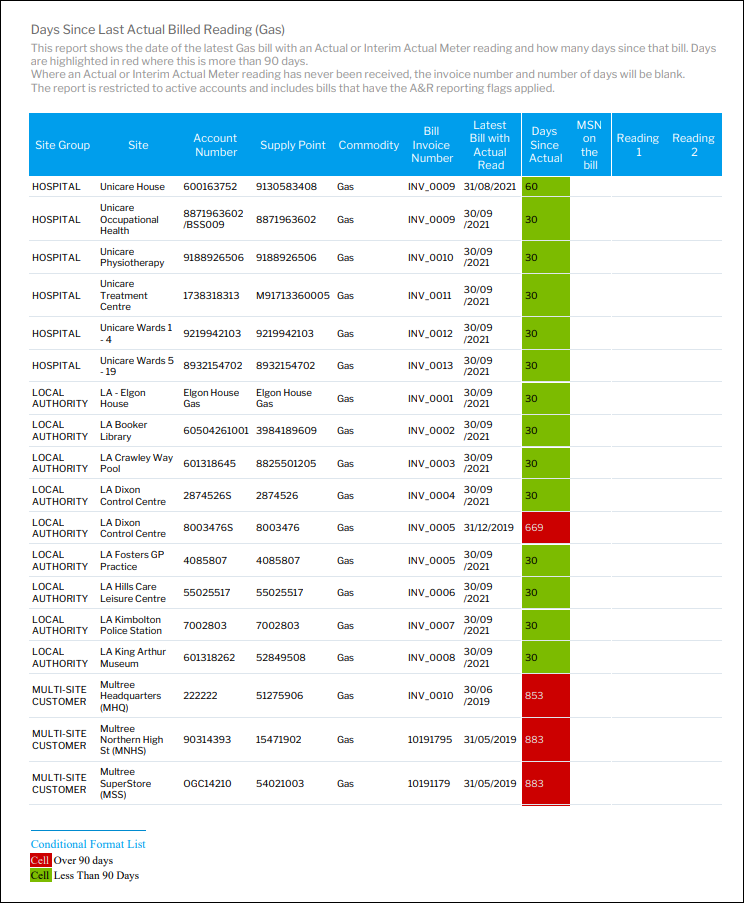
| Days Since Last Actual Billed Reading (Gas) |
| Days Since Last Actual Billed Reading (Gas)This report shows the date of the latest Gas bill with an Actual or Interim Actual Meter reading and how many days since that bill. Days are highlighted in red where this is more than 90 days. Where an Actual or Interim Actual Meter reading has never been received, the invoice number and number of days will be blank. The report is restricted to active accounts and includes bills that have the A&R reporting flags applied. |
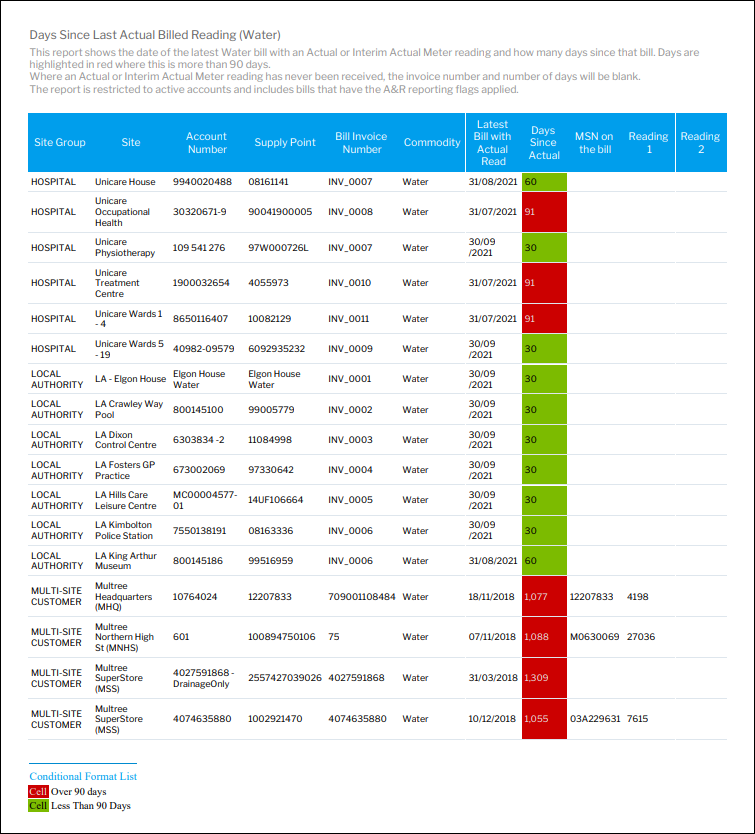
| Days Since Last Actual Billed Reading (Water) |
| Days Since Last Actual Billed Reading (Water)This report shows the date of the latest Water bill with an Actual or Interim Actual Meter reading and how many days since that bill. Days are highlighted in red where this is more than 90 days. Where an Actual or Interim Actual Meter reading has never been received, the invoice number and number of days will be blank. The report is restricted to active accounts and includes bills that have the A&R reporting flags applied. |
| Energy Management Overview Dashboard |
| Energy Management Overview DashboardAn Energy Management Dashboard that delivers a series of different objects to provide strategic level information across your estate, helping you start exploring your energy data. |
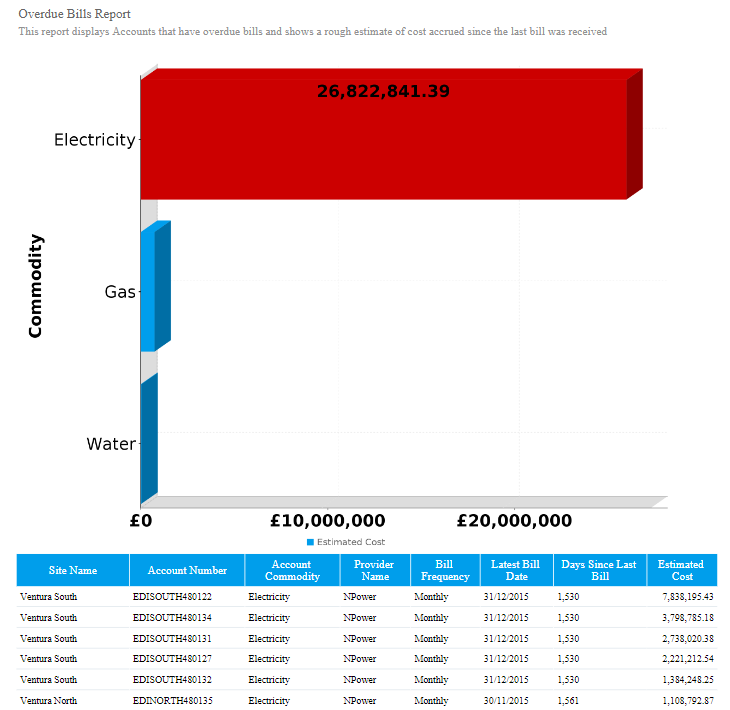
| Estimated Cost of Overdue Bills |
| Estimated Cost of Overdue BillsDisplays Accounts that have overdue bills and shows a rough estimate of cost accrued since the last bill was received |
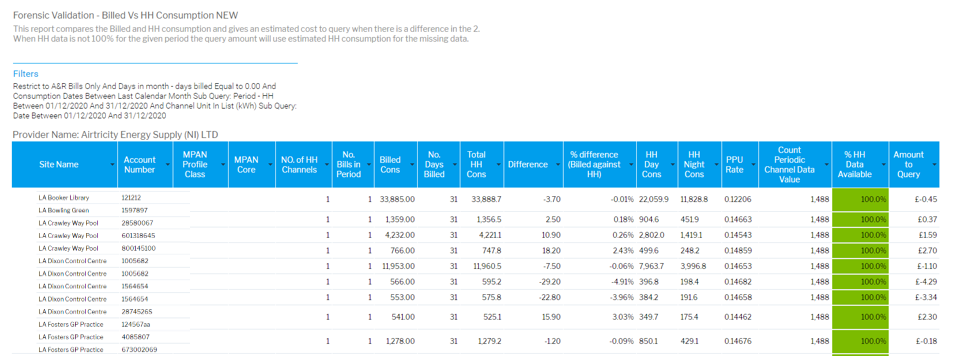
| Forensic Validation - Billed Vs HH Consumption |
| Forensic Validation - Billed Vs HH ConsumptionThis report compares the Billed and HH consumption and gives an estimated cost to query when there is a difference in the 2. |
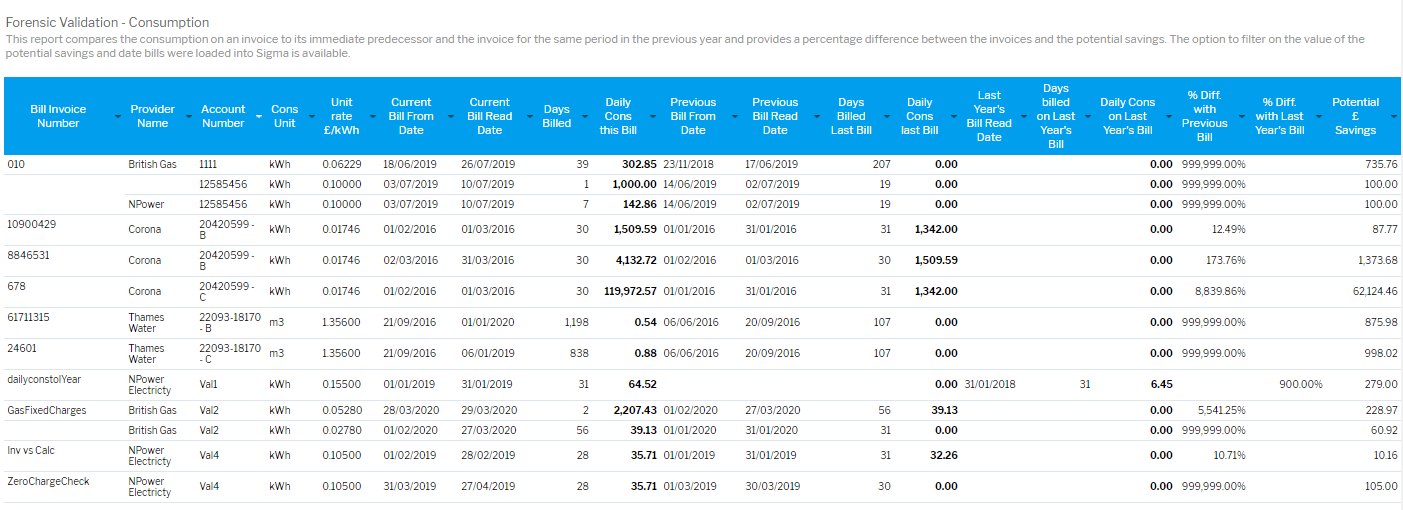
| Forensic Validation - Consumption |
| Forensic Validation - ConsumptionThis report compares the consumption on an invoice to its immediate predecessor and the invoice for the same period in the previous year and provides a percentage difference between the invoices and the potential savings. The option to filter on the value of the potential savings and date bills were loaded into Sigma is available. |
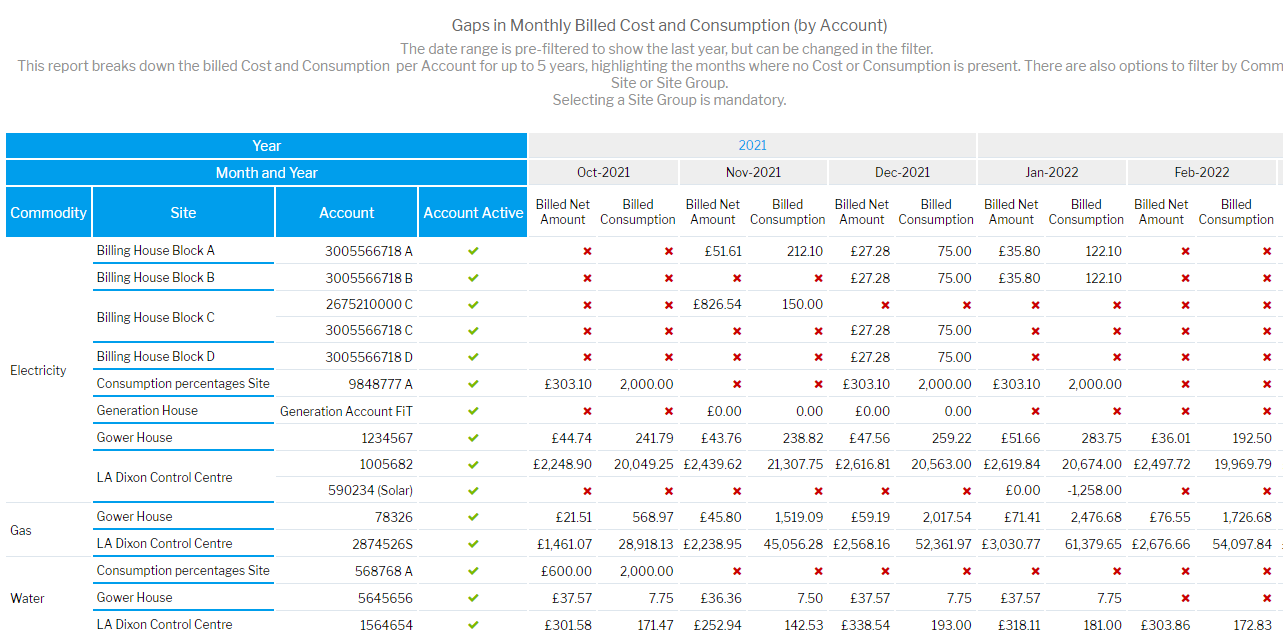
| Gaps in Monthly Billed Cost and Consumption (by Account) |
| Gaps in Monthly Billed Cost and Consumption (by Account)The date range is pre-filtered to show the last year, but can be changed in the filter. This report breaks down the billed Cost and Consumption per Account for up to 5 years, highlighting the months where no Cost or Consumption is present. There are also options to filter by Commodity, Site or Site Group. Selecting a Site Group is mandatory. |
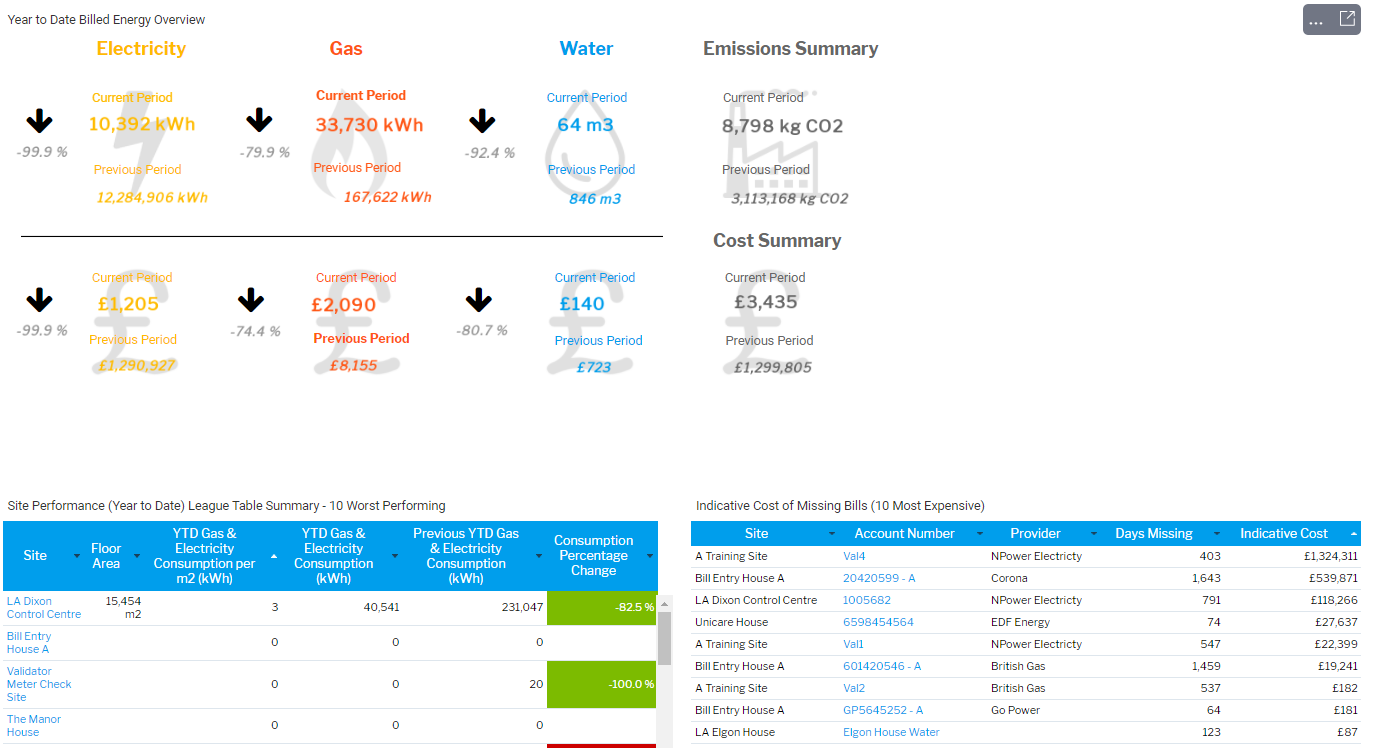
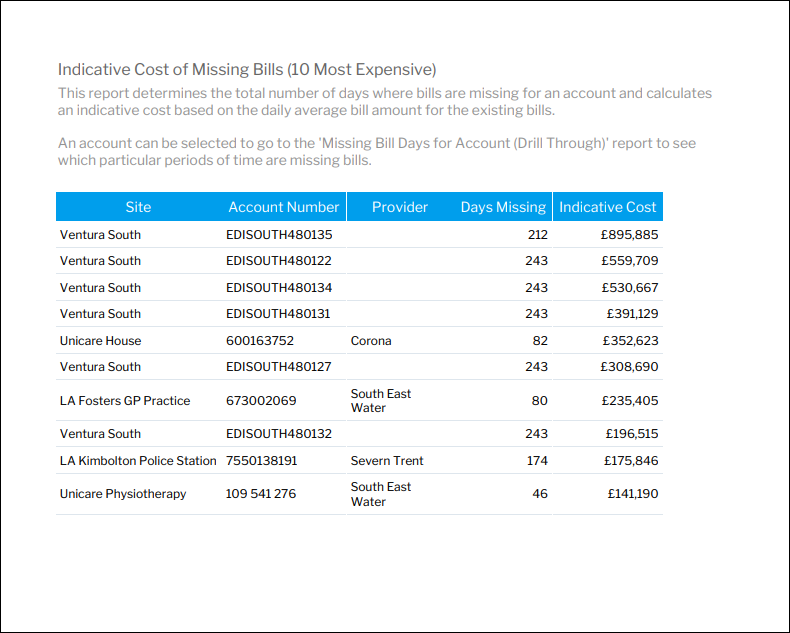
| Indicative Cost of Missing Bills (10 Most Expensive) |
| Indicative Cost of Missing Bills (10 Most Expensive)This report determines the total number of days where bills are missing for an account and calculates an indicative cost based on the daily average bill amount for the existing bills. An account can be selected to go to the 'Missing Bill Days for Account (Drill Through)' report to see which particular periods of time are missing bills. |
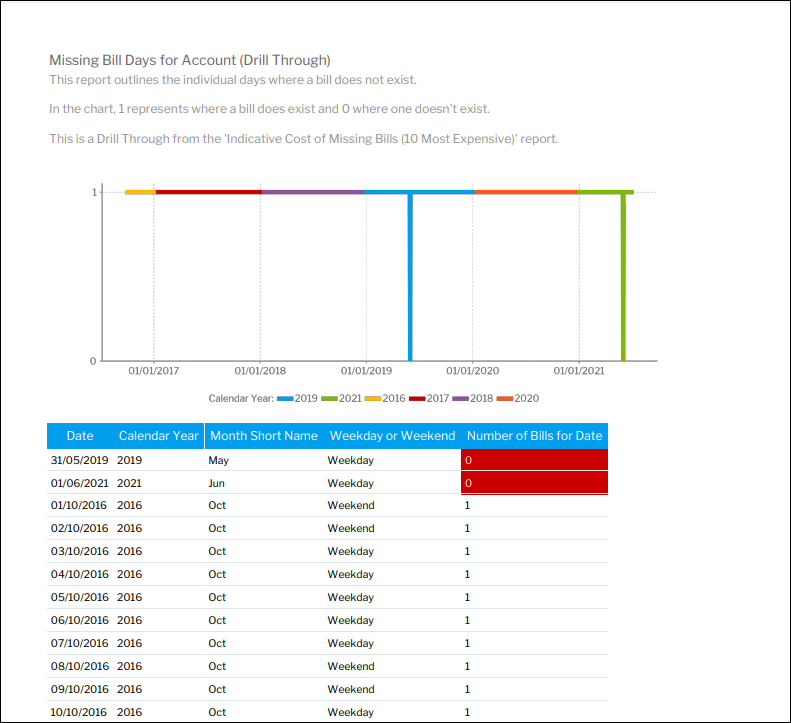
| Missing Bill Days for Account (Drill Through) |
| Missing Bill Days for Account (Drill Through)This report outlines the individual days where a bill does not exist. In the chart, 1 represents where a bill does exist and 0 where one doesn't exist. This is a Drill Through from the 'Indicative Cost of Missing Bills (10 Most Expensive)' report. |
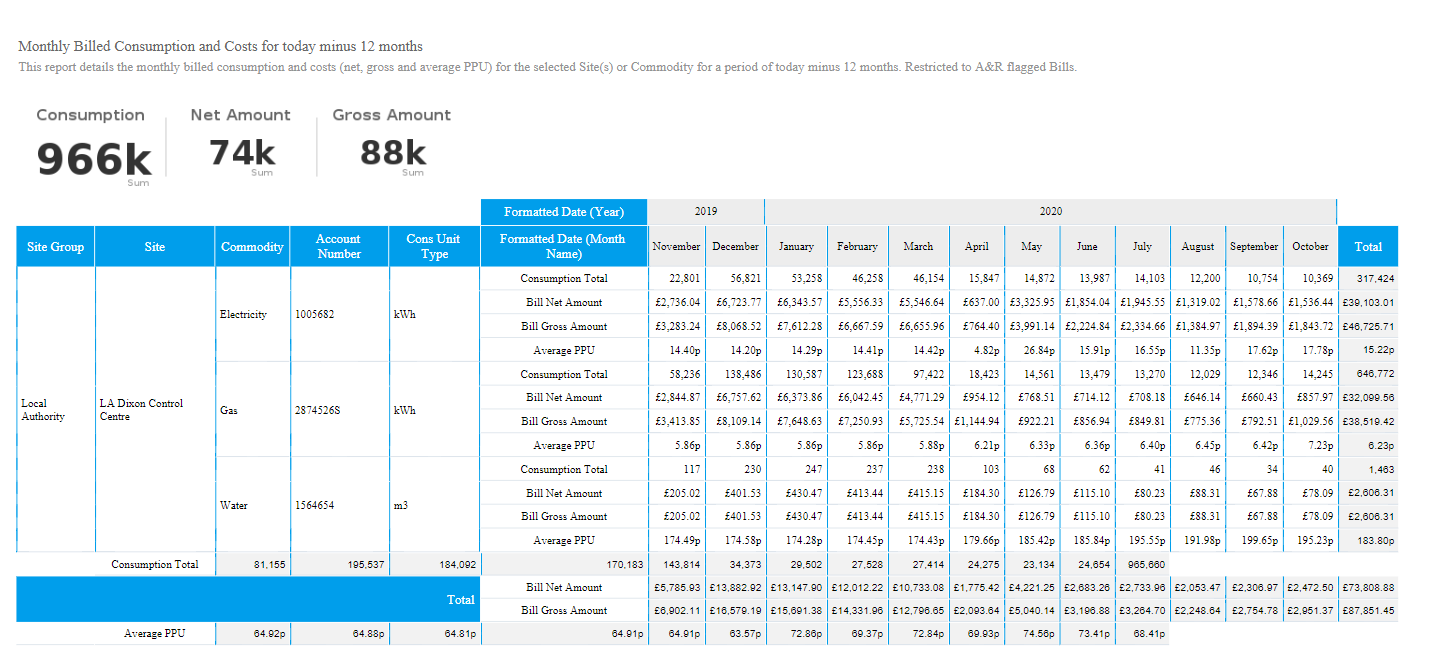
| Monthly Billed Consumption, Cost and average PPU for today minus 12 months |
| Monthly Billed Consumption, Cost and average PPU for today minus 12 monthsDetails the monthly consumption and costs (net, gross and average PPU) for the selected Site Group(s), Site(s) or Commodity for a period of today minus 12 months. |
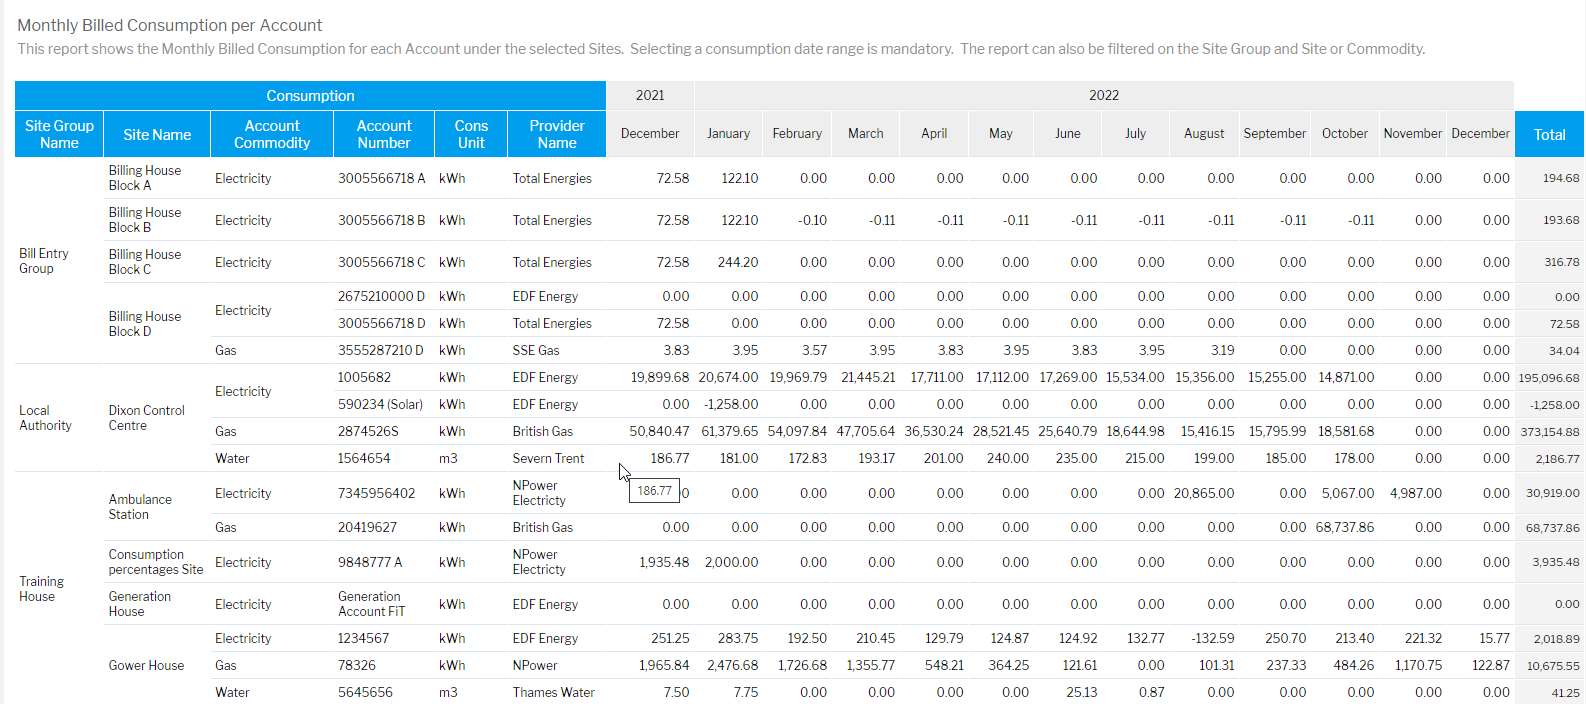
| Monthly Billed Consumption per Account |
| Monthly Billed Consumption per AccountThis report shows the Monthly Billed Consumption for each Account under the selected Sites. Selecting a consumption date range is mandatory. The report can also be filtered on the Site Group and Site or Commodity. |
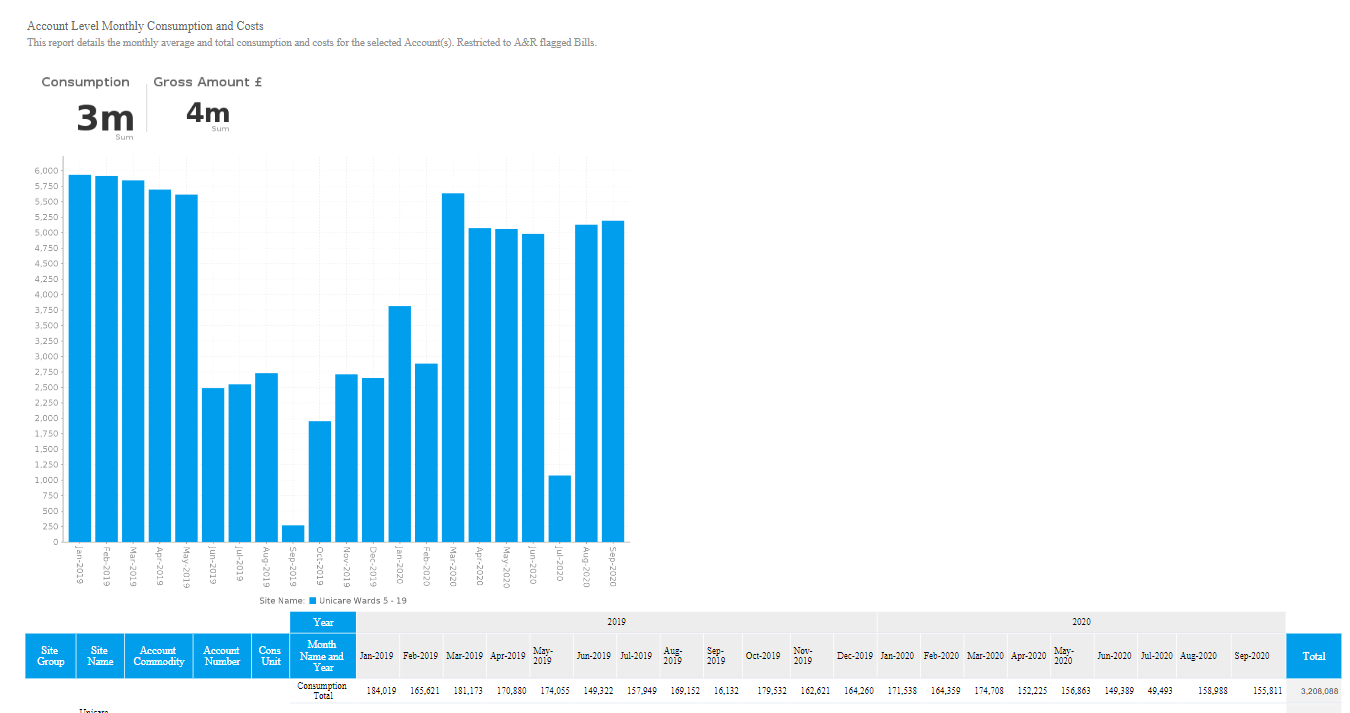
| Monthly Billed Cost, Consumption and Average Daily Consumption |
| Monthly Billed Cost, Consumption and Average Daily ConsumptionDetails the monthly average and total consumption and costs for the selected Account(s). Restricted to A&R flagged Bills. |
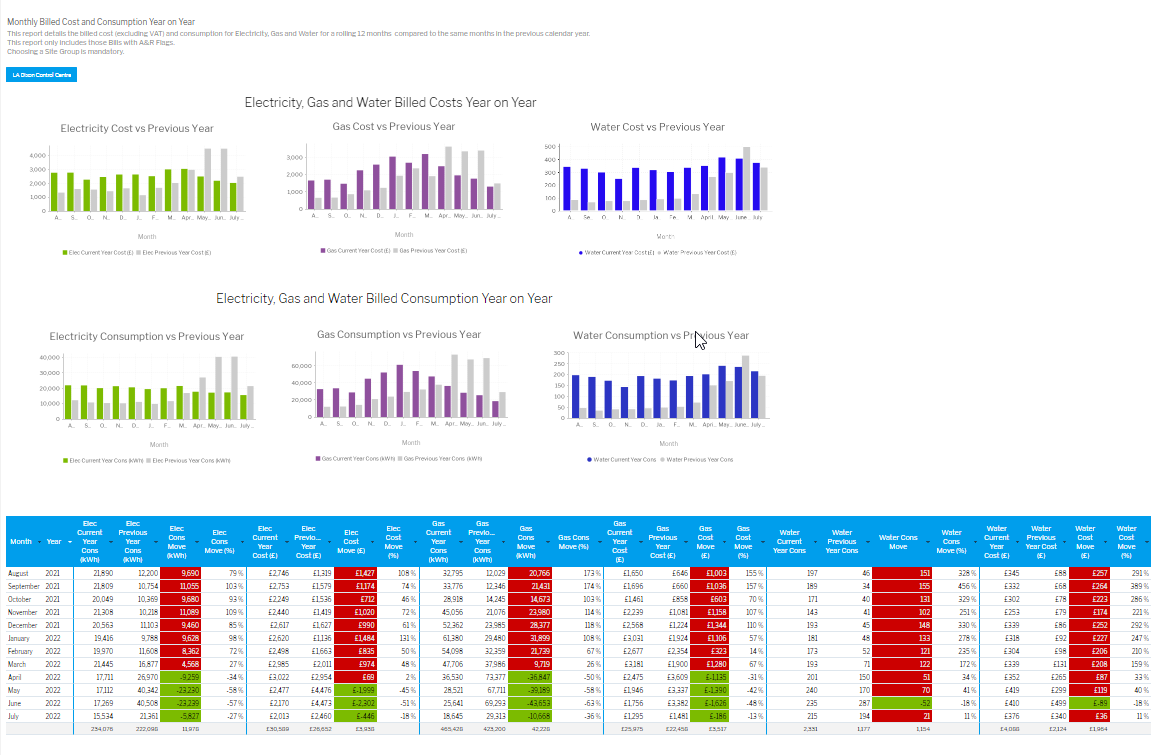
| Monthly Billed Cost and Consumption Year on Year |
| Monthly Billed Cost and Consumption Year on YearThis report details the billed cost cost (excluding VAT) and consumption for Electricity, Gas and Water for a rolling 12 months compared to the same months in the previous calendar year. This report only includes those Bills with A&R Flags. Choosing a Site Group is mandatory. |
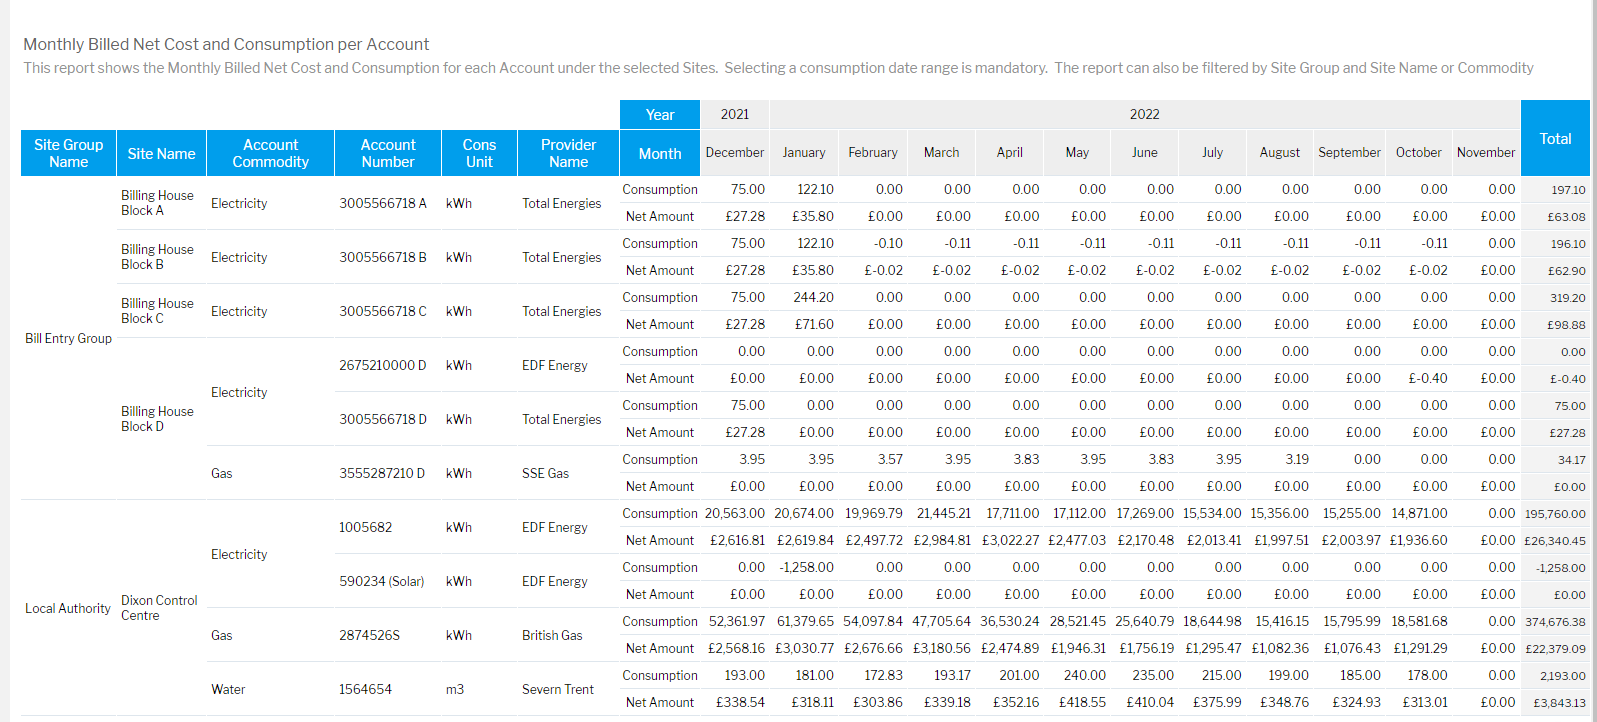
| Monthly Billed Net Cost and Consumption per Account |
| Monthly Billed Net Cost and Consumption per Account This report the Monthly Billed Net Cost and Consumption for each Account under the selected Sites. Selecting a consumption date is mandatory. The report can also be filtered by Site Group or Site Name or Commodity. |
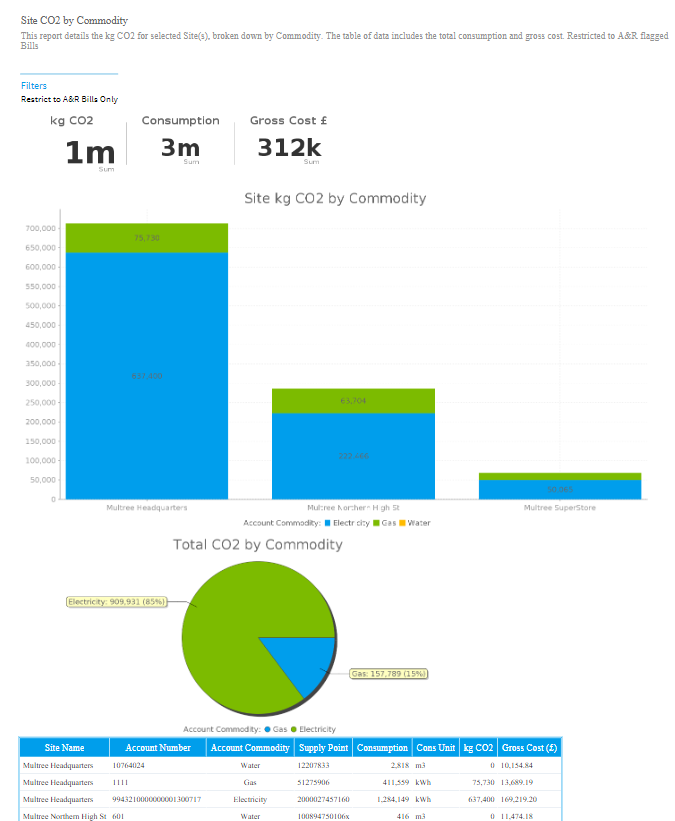
| Site Billed CO2 (stacked by Commodity) |
| Site Billed CO2 (stacked by Commodity)Details the kg CO2 from the Accounts in selected Site(s), broken down by Commodity. The table of data includes the total consumption and gross cost. |
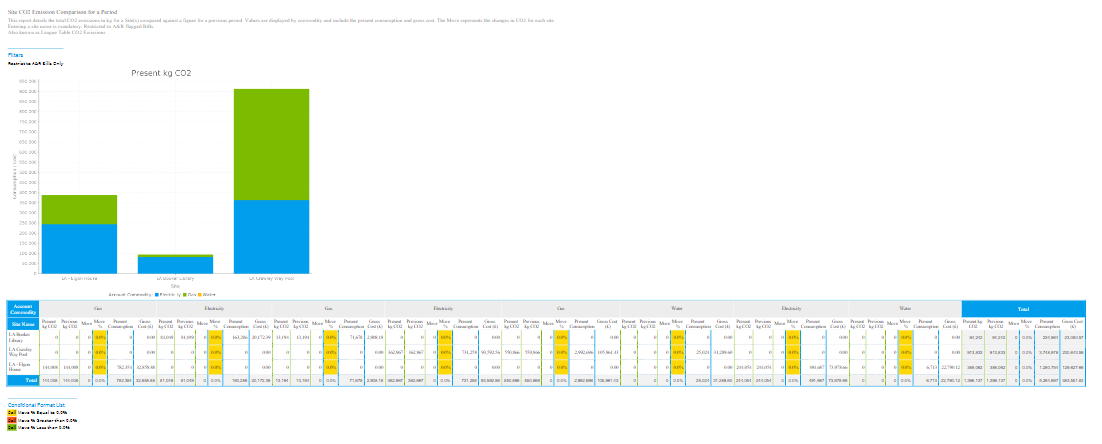
| Site Billed CO2 Emission Comparison for a Period |
| Site Billed CO2 Emission Comparison for a PeriodDetails the total CO2 emissions in kg for a Site(s) compared against a figure for a previous period. Values are displayed by commodity and include the present consumption and gross cost. The Move represents the changes in CO2 for each site. Also known as League Table CO2 Emissions. |
| Site Billed Consumption Comparison for Selected Periods (includes Cost and CO2) | 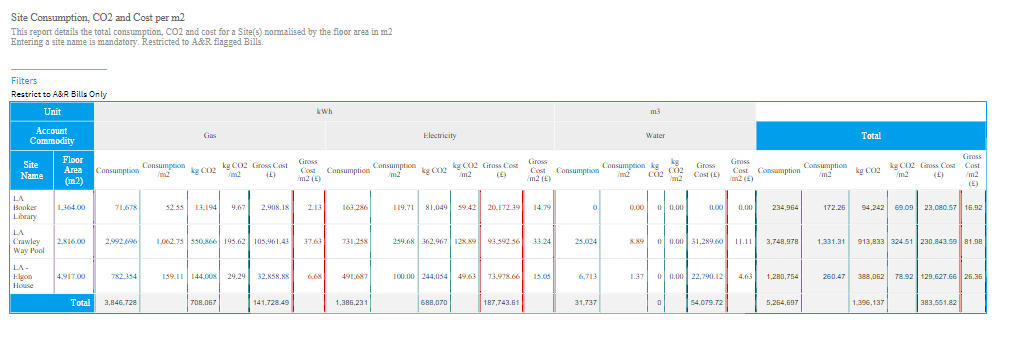 | Site Billed Consumption Comparison for Selected Periods (includes Cost and CO2)Details the consumption for a Site(s) compared against a figure for a previous period. Values are displayed by commodity and include the present kg CO2 and gross cost. The Move column in the results table represents the changes in Consumption for each site. Also known as League Table Any Period. |
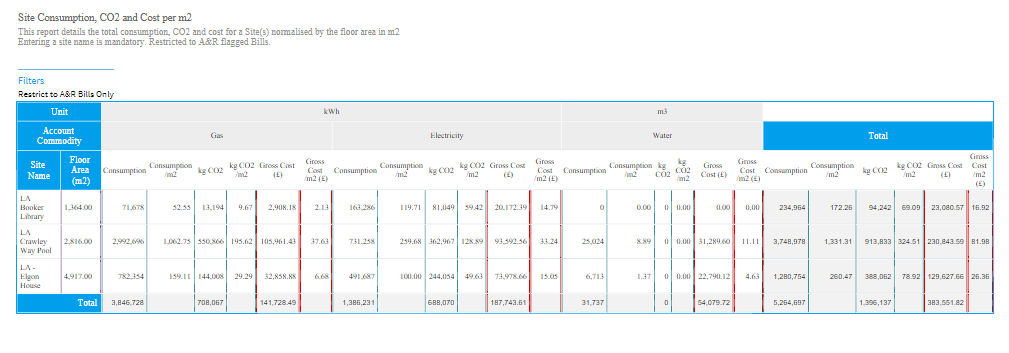
| Site Billed Consumption, CO2 and Cost per m2 |
| Site Billed Consumption, CO2 and Cos per m2Details the total consumption, CO2 and cost for a Site(s) normalised by the floor area in m2 |
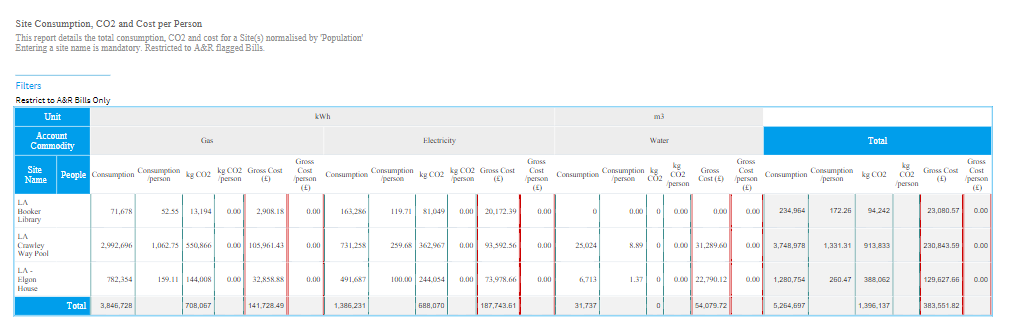
| Site Billed Consumption, CO2 and Cost per Person |
| Site Billed Consumption, CO2 and Cost per PersonDetails the total consumption, CO2 and cost for a Site(s) normalised by 'Population' |
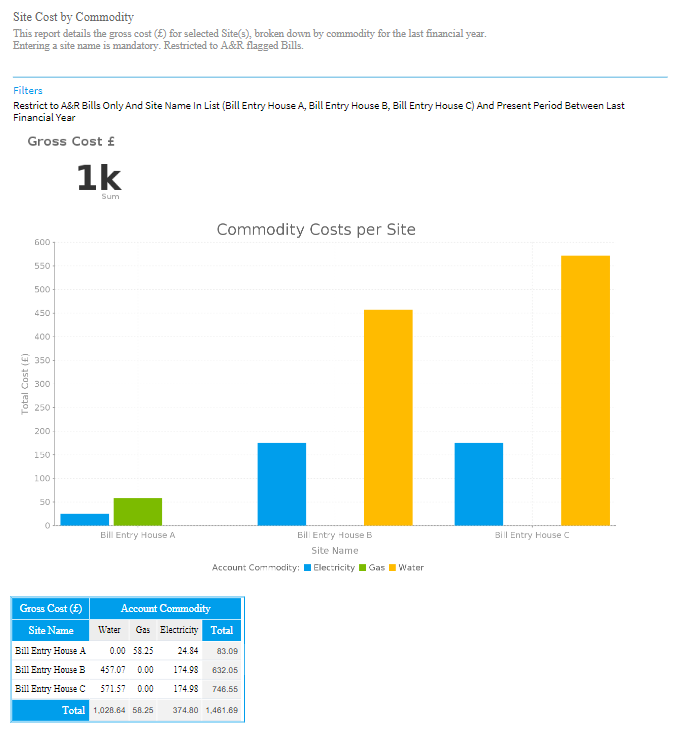
| Site Cost by Commodity for the Last Financial Year | Site Cost by Commodity for the Last Financial YearDetails the gross cost (£) for selected Site(s), broken down by commodity for the last financial year. | |
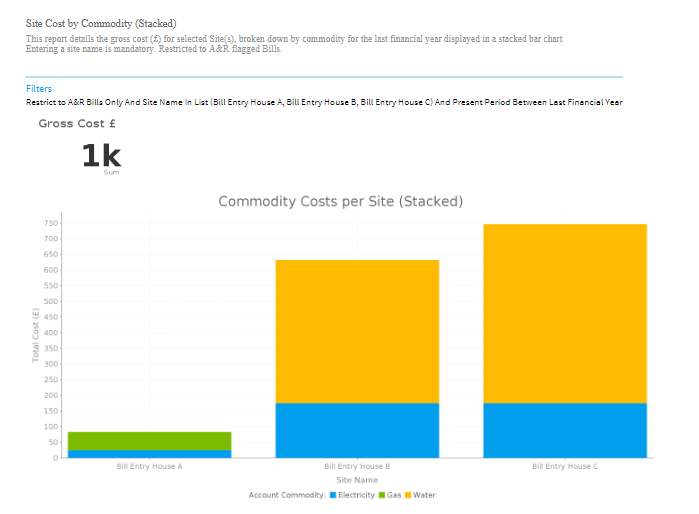
| Site Cost by Commodity (Stacked) for the last Financial Year |
| Site Cost by Commodity (Stacked) for the last Financial YearDetails the gross cost (£) for selected Site(s), broken down by commodity for the last financial year displayed in a stacked bar chart |
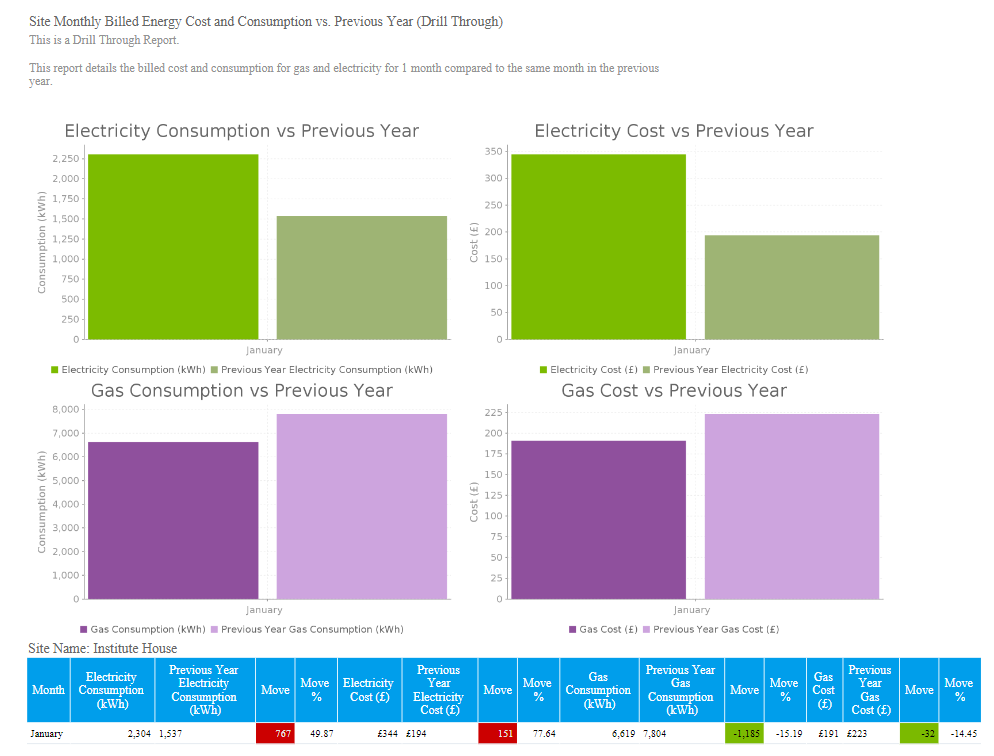
| Site Monthly Billed Gas and Electricity Cost and Consumption vs. Previous Year (Drill Through) |
| Site Monthly Billed Gas and Electricity Cost and Consumption vs. Previous Year (Drill Through)This is a Drill Through Report. |
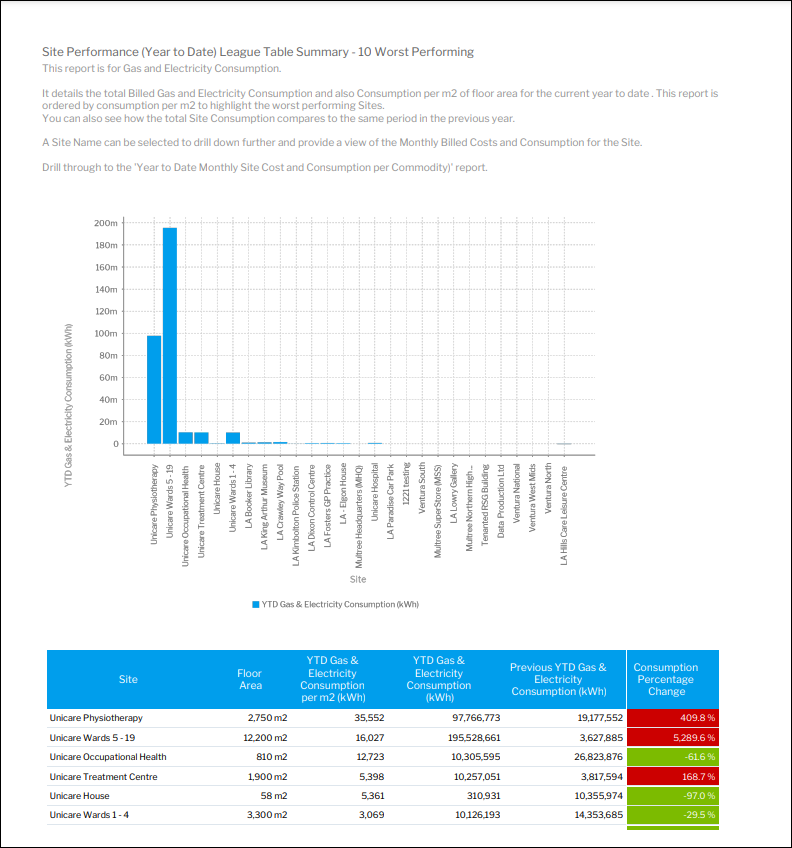
| Site Performance (Year to Date) League Table Summary - 10 Worst Performing |
| Site Performance (Year to Date) League Table Summary - 10 Worst PerformingThis report is for Gas and Electricity Consumption. It details the total Billed Gas and Electricity Consumption and also Consumption per m2 of floor area for the current year to date . This report is ordered by consumption per m2 to highlight the worst performing Sites. A Site Name can be selected to drill down further and provide a view of the Monthly Billed Costs and Consumption for the Site. Drill through to the 'Year to Date Monthly Site Cost and Consumption per Commodity)' report. |
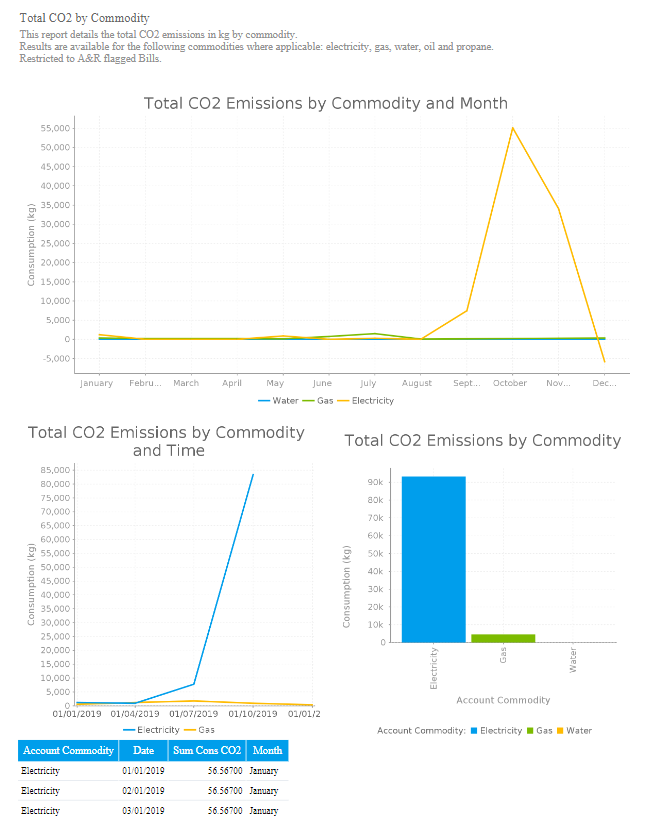
| Total CO2 by Commodity |
| Total CO2 by CommodityDetails the total CO2 emissions in kg by commodity. |
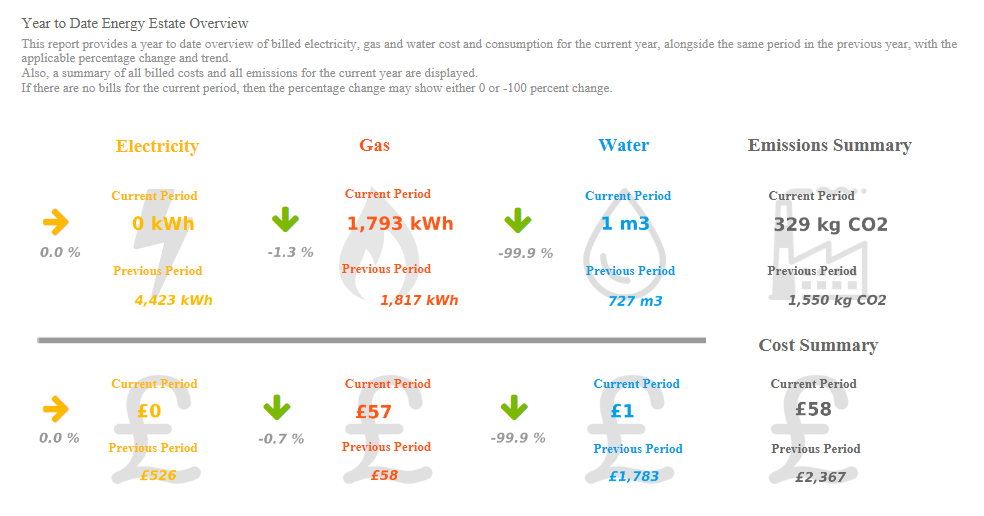
| Year to Date Billed Energy Overview |
| Year to Date Billed Energy OverviewProvides a year to date overview of billed electricity, gas and water cost and consumption for the current year, alongside the same period in the previous year, with the applicable percentage change and trend. |
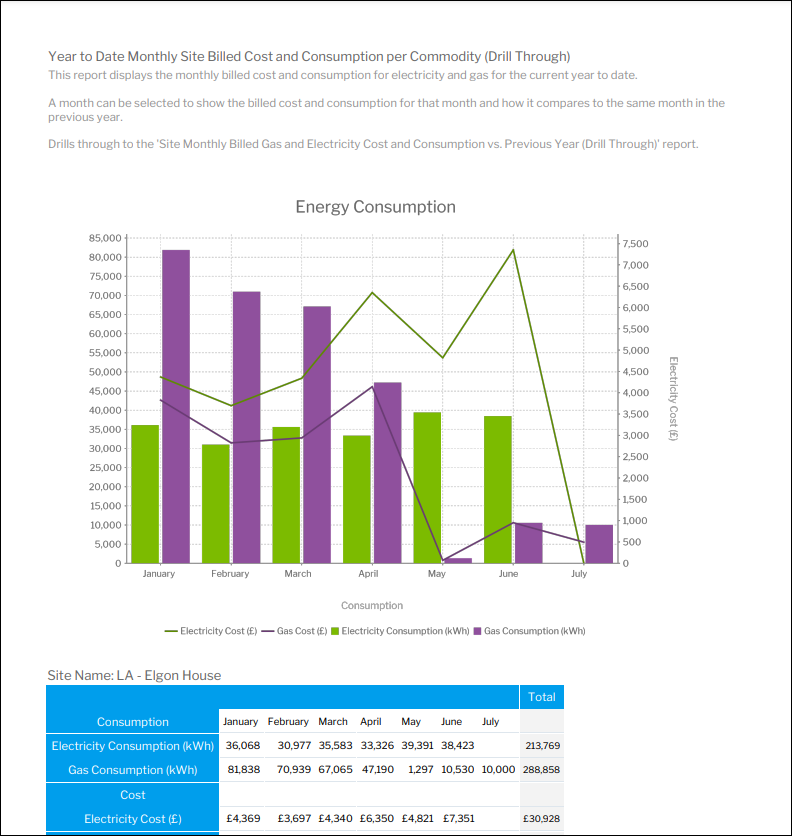
| Year to Date Monthly Site Billed Cost and Consumption per Commodity (Drill Through) |
| Year to Date Monthly Site Billed Cost and Consumption per Commodity (Drill Through)This report displays the monthly billed cost and consumption for electricity and gas for the current year to date. A month can be selected to show the billed cost and consumption for that month and how it compares to the same month in the previous year. Drills through to the 'Site Monthly Billed Gas and Electricity Cost and Consumption vs. Previous Year (Drill Through)' report. |
Related content
@ Copyright TEAM - Energy Auditing Agency Limited Registered Number 1916768 Website: www.teamenergy.com Telephone: +44 (0)1908 690018