The View Bills section provides year-on-year consumption or cost information for all utilities with export facilities to excel and pdf.
Sigma Online User Manual
Energy Viewer - Bills
- Graham Paul
- Kim Blake
Owned by Graham Paul
Accessing the Bill Information
Open the Energy Viewer https://www.sigmaenergyviewer.com and use your Sigma log on details
Click on:
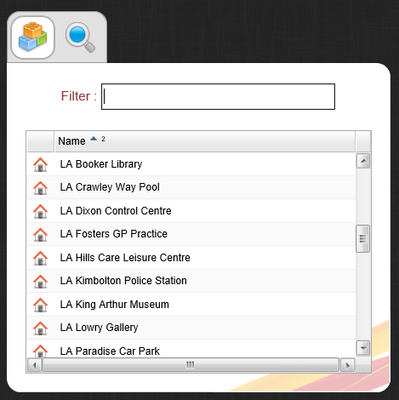
If your log on permits you to see more than one Site, scroll down or search for the required site
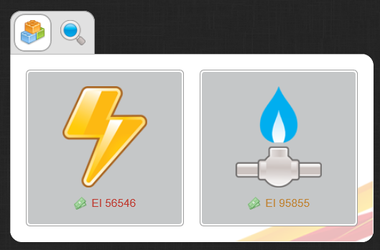
If your Site has more than one Account, the following will be displayed
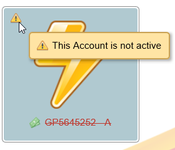
If an Account is inactive, the Exclamation mark will notify you (this will not stop you from view the bills).
Click on an Account to view more detail
This screen shows the following detail:
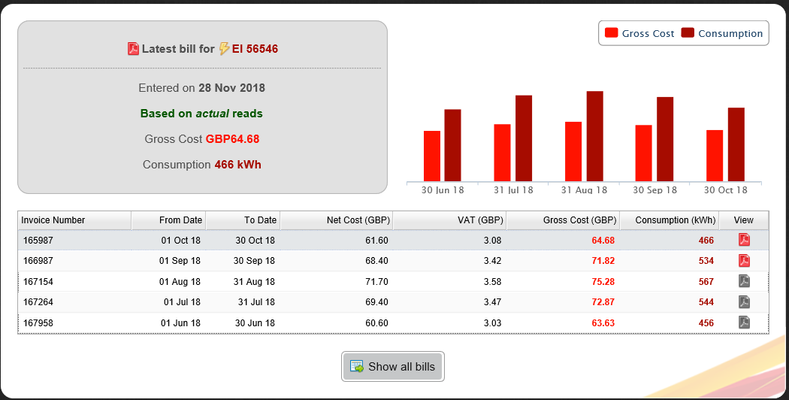
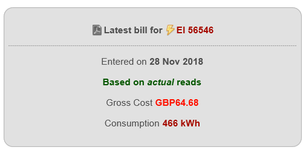
Latest Bill (top left)
- the entered date
- whether it is actual readings
- what the gross cost is
- what the consumption is
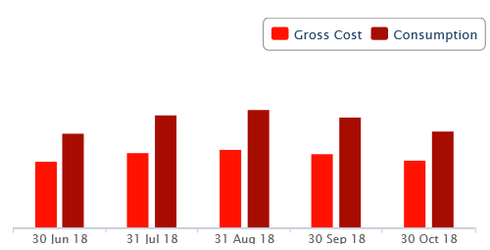
Cost and Consumption (top right)
- the latest cost
- the latest consumption
You can hide either the Cost or Consumption by clicking on the words Gross Cost or Consumption
Click again to reintroduce the columns
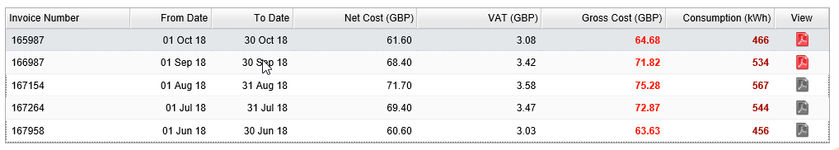
Bills (bottom section)
The list shows:
- the invoice number
- the from date
- the to date
- the net cost
- the VAT
- the gross cost
- the consumption
Each bill can be viewed by clicking on 
 shows a full list of all the bills
Analysing the Bills
Click on Analyse Data
Then click on Utility Analysis
Choose the Site you want to Analyse (if you have permissions to view more than one Site)
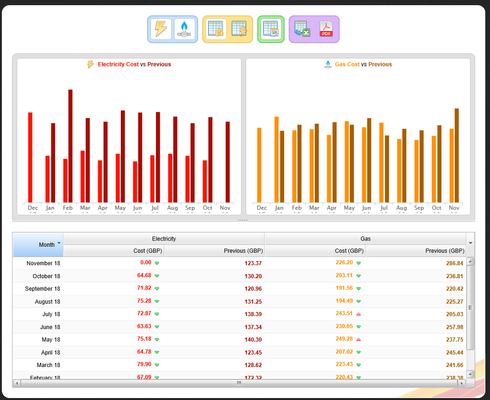
Icons
Commodity Selection
- Up-to four commodities will be displayed, default of Electricity will be displayed if available
Cost or Consumption
- Gross Cost is selected by default, but you can switch it to view Consumption instead
Previous Year

- this button will add in an additional column showing either the Cost or Consumption for the same month the previous year
Exports

- there are two options, export the table to Excel or to pdf.
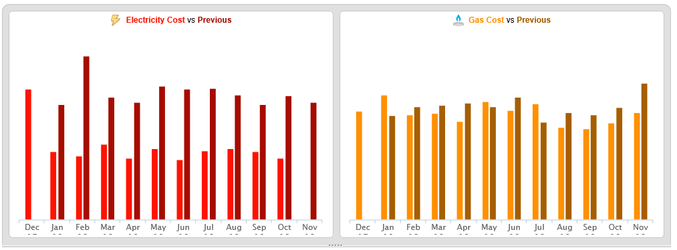
Graphs
The graphs will display up to four charts if the commodities are available with Cost vs Previous Year as the default. The charts always display up to the last full complete month and are colour co-ordinated with the table below.
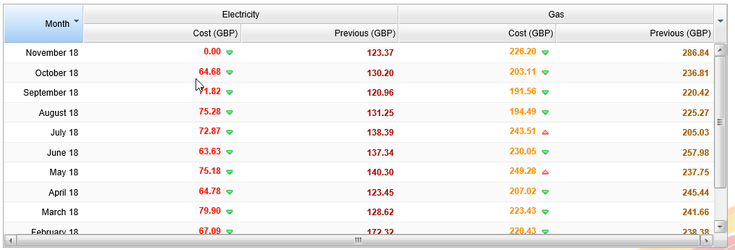
Table
The table will correspond to the graph providing a detailed view of the data with an indication of the performance against the previous year with move arrows. A red arrow indicates an increase, a green arrow indicates a decrease.
Where does the data come from and how do you get the best out of Utility Analysis?
- The data is collected from all accounts (inactive and active) that belong to the selected site
- This is only a 'billing data' activity and will not be appropriate for meter data - please use 'Meter Analysis' for meter data
@ Copyright TEAM - Energy Auditing Agency Limited Registered Number 1916768 Website: www.teamenergy.com Telephone: +44 (0)1908 690018