Sigma Online User Manual
Energy Viewer - Meter Analysis
- Graham Paul
- Kim Blake
Introduction
The Meter Analysis activity provides a browsing tool to view AMR or Half hourly data at meter level for either a week or month period and with an additional comparison against the previous year.
Accessing the Meter Analysis
Open the Energy Viewer https://www.sigmaenergyviewer.com and use your Sigma log on details
Click on:
Then click on:
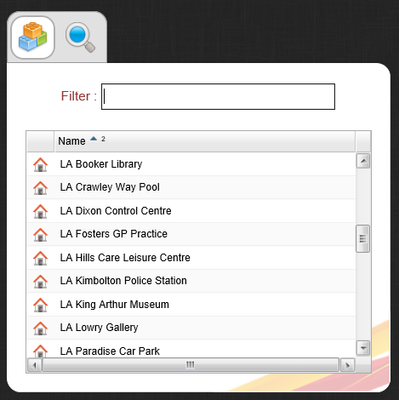
If your log on permits you to see more than one Site, scroll down or search for the required site
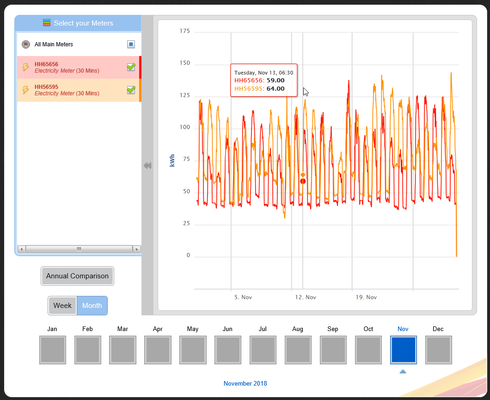
Select your Meters section
All available meters are displays on the graph.
Add / Hide data from the graph, click on the relevant Meter. The colour that the meter is highlighted corresponds to the line colour on the graph.
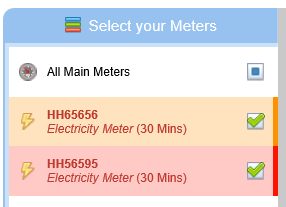
Each Meter that is ticked, will be displayed on the graph. The colours in the Select your Meters section will correspond with the graph
Annual Comparison section
Annual Comparison will add on additional historical data line for any meters or site selected. The previous year's data will be a a darker shade of the current data for each Meter or Site

Period Selection section
The Period Selection will default to the week with the most recent data available highlighted in blue. Choosing another week will automatically update the graph. The past 52 weeks or 12 months will always be available to select
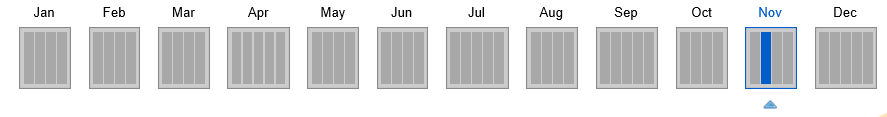
Week / Months
'Week | Month' button allows you to toggle the period shown on the graph; the period selection is updated to either monthly or weekly selections.

Graph
The main graph plots the data at 30 minute intervals. Selecting part of the graph will zoom into the data further, with a 'Reset Zoom' button appearing to go back to the default. Hovering over (or clicking on Tablets) any data point will provide the date, time, meter number and value
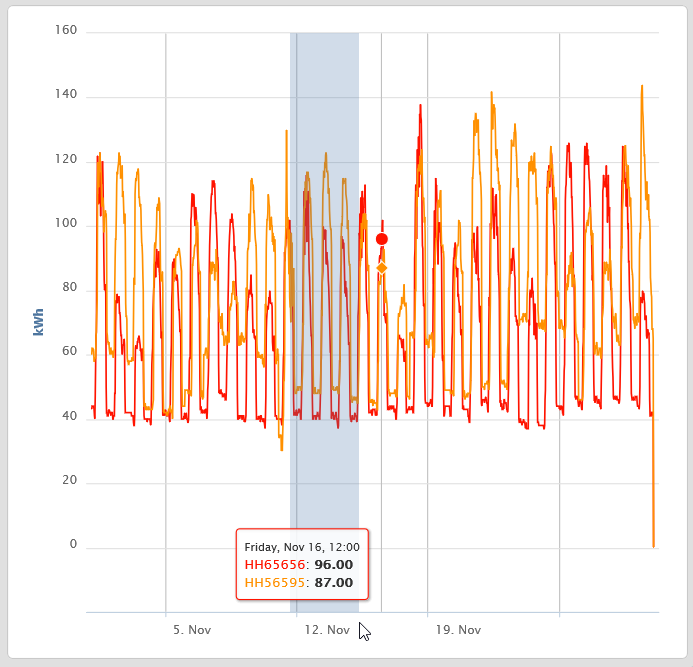
Expanding the graph is useful if you are using a smaller screen or many meters, however, the default view will always show all the options as above

Where does the data come from and how do you get the best out of Meter Analysis?
The activity will display any Meter that has a consumption periodic channels (with data recorded at regular intervals) for gas and electricity.
If the Site is selected (indicated by a green tick) then 1 line on the graph will display a total of all meters available at the site for the period selected.
Annual Consumption will show you the selected week compared to 52 weeks previous, or the selected month against the month last year.
@ Copyright TEAM - Energy Auditing Agency Limited Registered Number 1916768 Website: www.teamenergy.com Telephone: +44 (0)1908 690018