Sigma Online User Manual
Understanding / Running a Report in EI
This section shows you how to run a report in Energy Intelligence.
**Click here for a pre recorded training session for additional help and guidance - Understanding and Running a Report in Energy Intelligence which includes understanding the layout, how to run a report, filtering, adding to favourites and refreshing the Data
Opening Energy Intelligence
Energy Intelligence can be opened in one of the following ways:
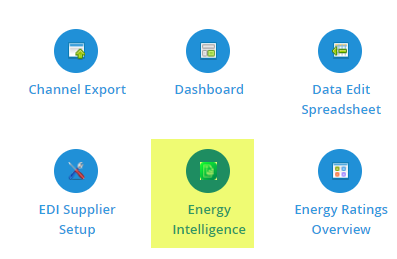
- Click on the Icon from the Welcome Page

- OR from an Activity, choose Energy Intelligence from the Options dropdown
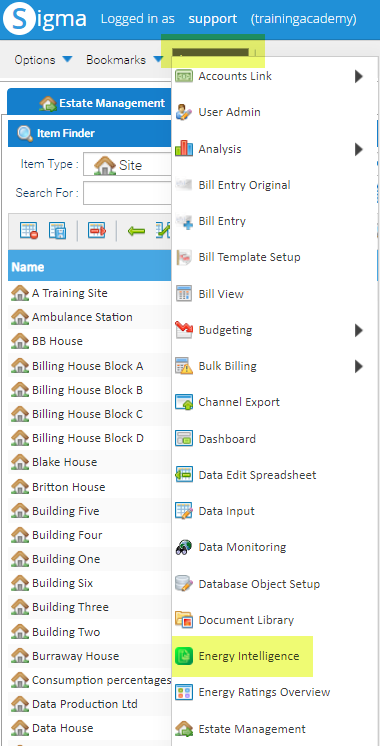
- OR, click on Energy Intelligence from the Activity Launcher
All of the above will open Energy Intelligence:
The layout
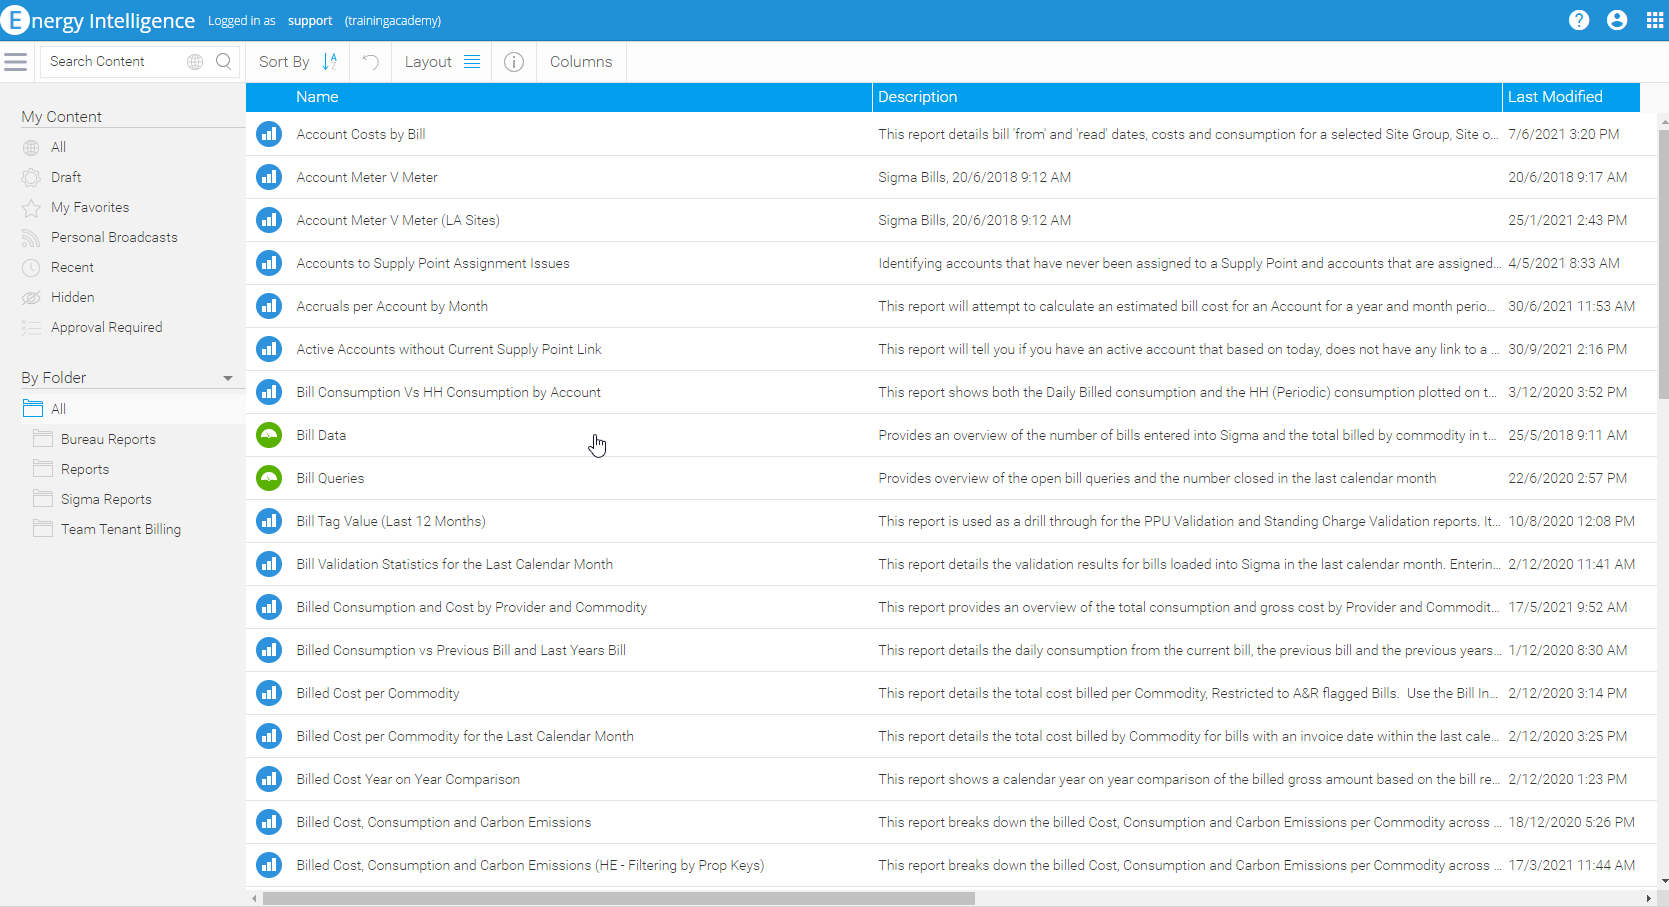
When Energy Intelligence is opened, you will be presented with either a List of reports or Thumbnails.
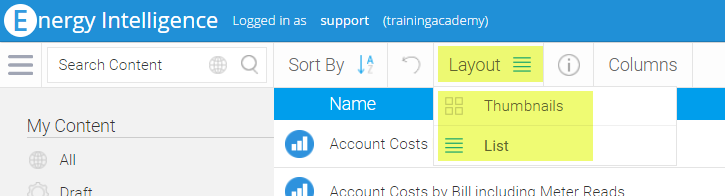
Changing the View
- Click Layout and change between List and Thumbnails
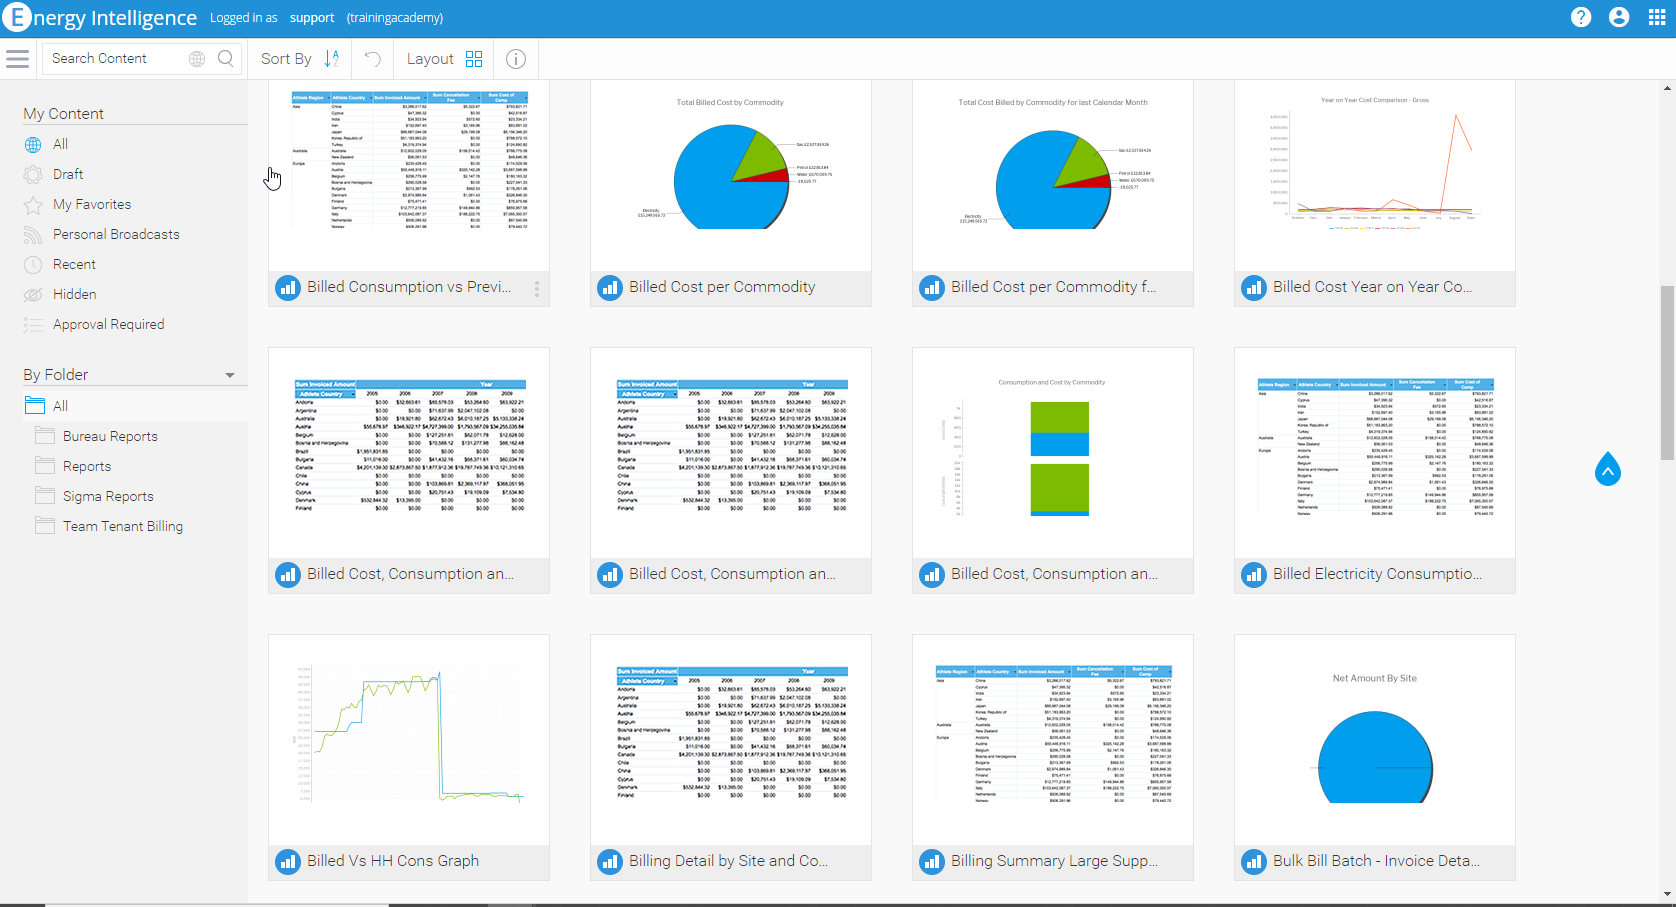
Report / Dashboard Icons
 Reports are identified by a blue circle
 Dashboards (a collection of Reports) are identified by a green circle
Folders
Energy Intelligence has two main Folders, My Content and By Folder, which then have Subfolders.
To search/view all reports (both Sigma and User created), ensure you are in the All subfolders in both folders.
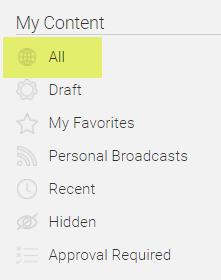
My Content section
To view all reports in this section, you need to be on All in the My Content section
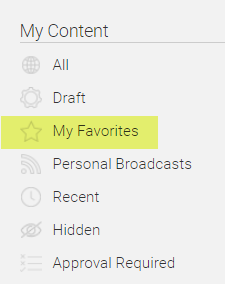
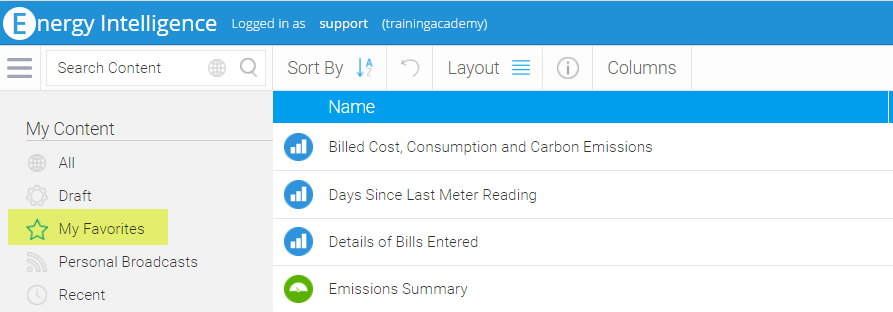
My Favorites Folder
The My Favorites folder shows any reports you have marked as a favourite (see below for more details on how to)
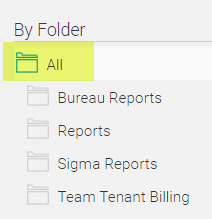
By Folder section
Reports are either added into Energy Intelligence by Team or Users copy/create reports and save them into the Reports in the By Folder section. The By Folders section helps you filter to the type reports you want to see.
All Folder
Shows all the reports in Energy Intelligence, and divides them into subfolders.
Note, reports in the Bureau Reports, Sigma Reports and Team Tenant Billing Subfolders are created and owned by Team and can not be edited or deleted. They can be copied and saved into the Reports folder.
Reports in the Reports folder are created on an individual database (either by Users or by Team on a Users behalf) and are bespoke to that database. These reports can be edited and/or deleted.
Bureau Reports Sub Folder
These reports are used by our Bureau but are available for all Users. They are generally used for additional validation checks on invoices.
Reports Sub Folder
These reports are unique to each database and have been created by the User or by Team on the Users behalf. The folder can have additional subfolders for the User to organise their own reports
Sigma Reports Subfolder
These reports are divided into further folders based on the Views in Energy Intelligence. A View is the main source of the data.
Click here for more information on the EI Data Guide.
- The folders are as follows:
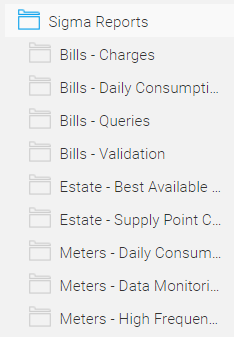
- Bills - Charges
- Reports using the billing data, such as the cost, VAT, consumption, standing charge etc
- Bills - Daily Consumption
- Reports based on the consumption from the bills. Some reports also include cost
- Bills - Queries
- Reports to analyse both the Open and Closed Queries
- Bills - Validation
- Reports to analyse the Bill validation results
- Estate - Best Available Consumption
- Reports using both Metered and Billed consumption data . Click here for more information regarding configurating the hierarchy of data used, estimation techniques and forecasting options
- Estate - Supply Point Configuration
Provides access to Sigma items that relate to Supply Points and Configuration
- Meters - Daily Consumption
- Reports to analyse the Periodic and Non Periodic metering data
- Meters - Data Monitoring
- Reports based on the results of the Data Monitoring Activity
- Meters - High Frequency Consumption
- Reports to analyse the Periodic (HH) data with the ability to see the data at the half hour granularity
Note: All reports in Energy Intelligence will show up to 5 years of data, apart from those in the High Frequency Periodic Data View. These reports show up to 14 months.
Team Tenant Billing Sub Folder
These reports are specifically for Users who have the Tenant Billing Activities within Sigma
Best Available Consumption Data View Reports Configuration
Reports in the Best Available Consumption Data View folder have some additional configuration:
- A valid Supply Point needs to be in Sigma to enable data to show in these reports. The Supply Point needs to have a valid Contract, along with an Account and a Meter
- The results are based on a configurable hierarchy of data from Sigma. This includes the Periodic Data, Non Periodic Data, Billed Data and Supplier Statements
- Estimation Techniques can be configured
- Forecasting Techniques can be configured
For more information on the configuration, click on the following links:
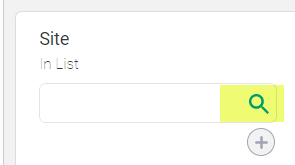
Searching
Use the Search field to find a report.
- Enter the name / partial name of the report you want to use, or a common word such as 'emissions'
- Click on the magnifying glass or press return
![]()
- The reports meeting the criteria will be displayed
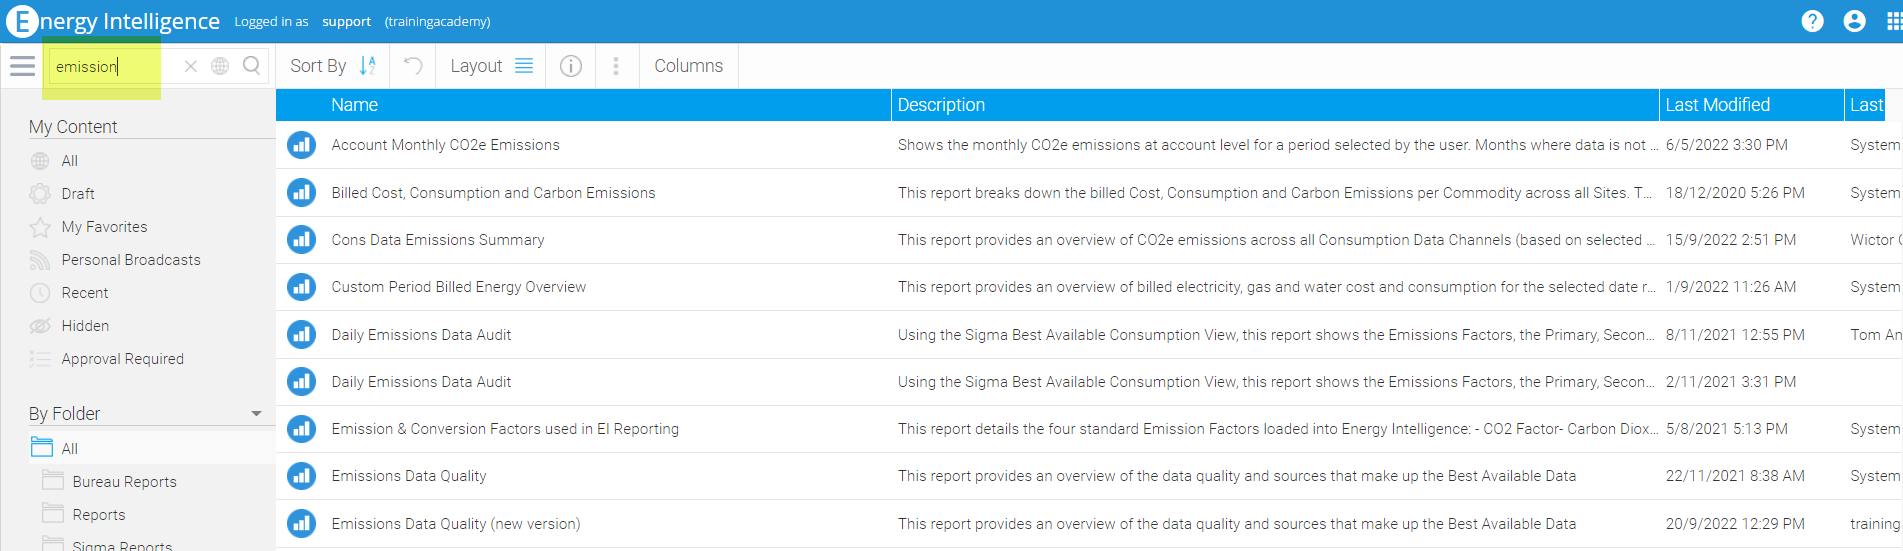
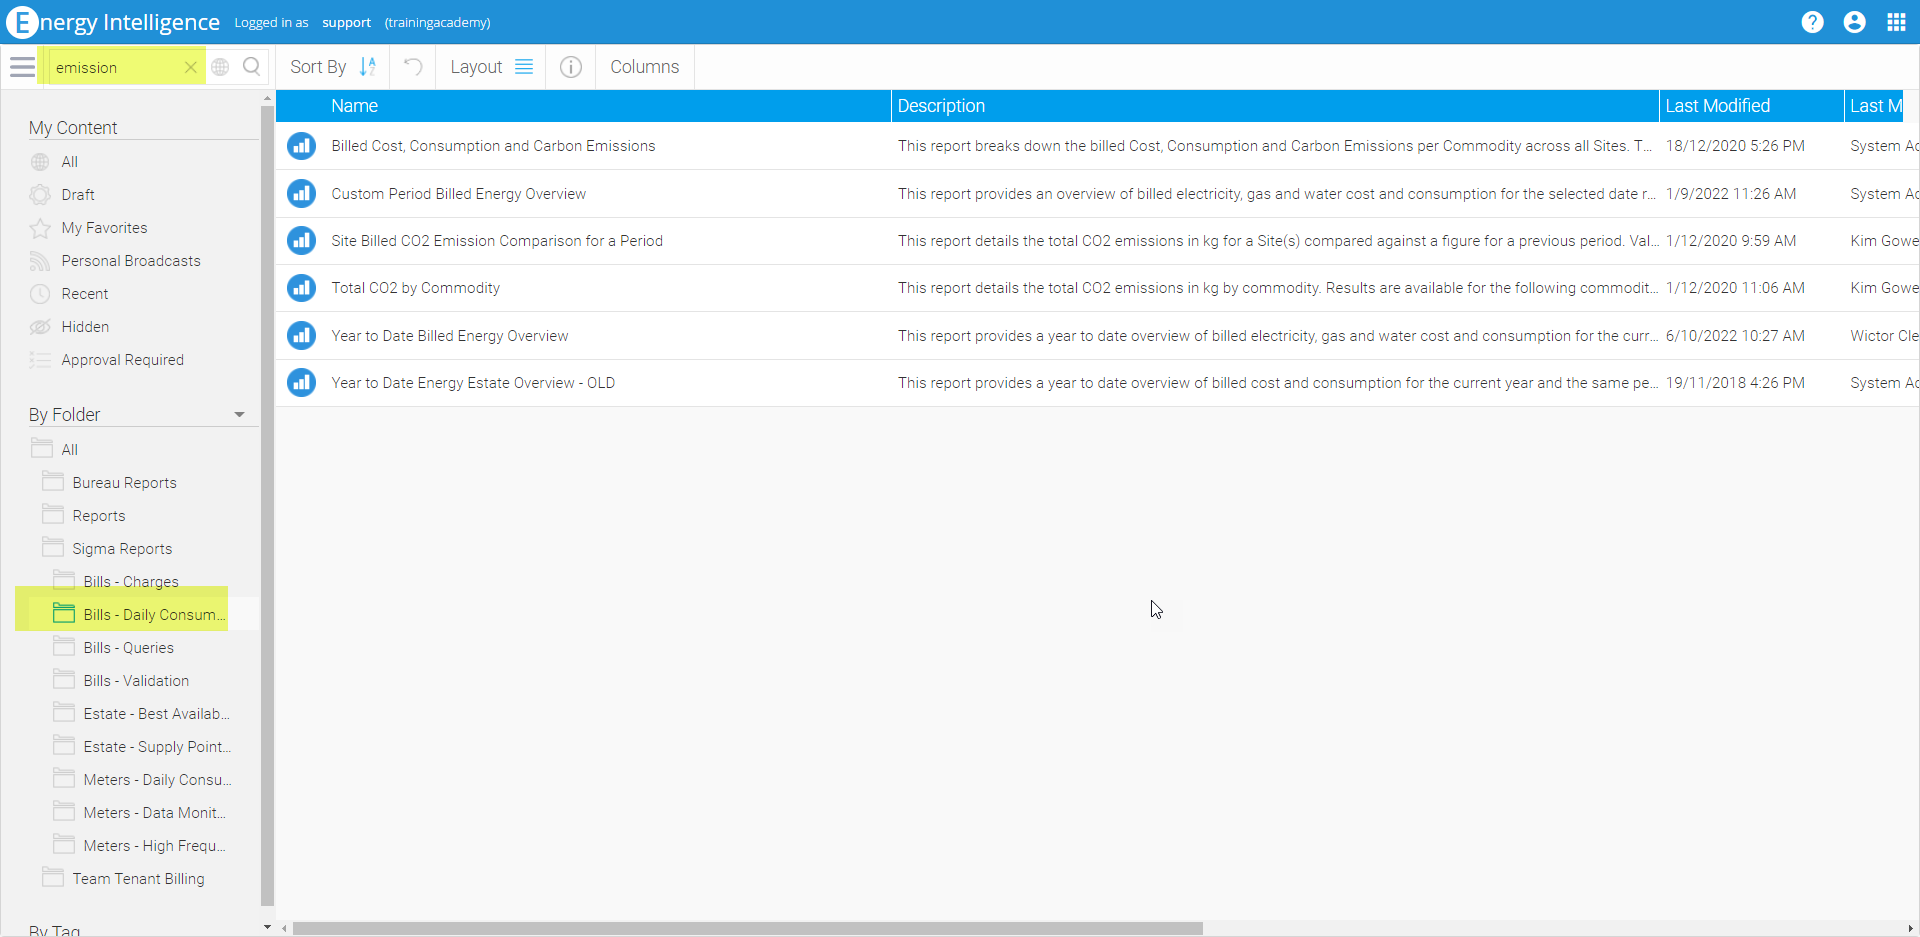
- To see reports from a specific folder, highlight the folder, then search
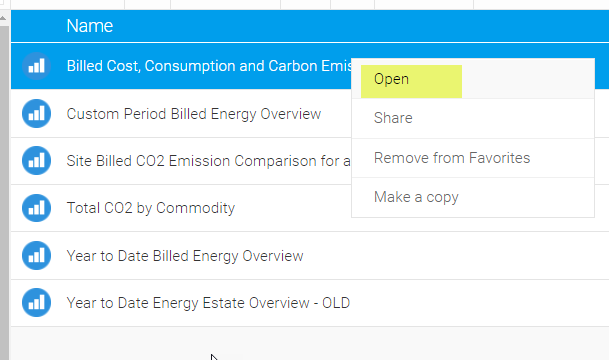
Opening a Report
- From the main page, double click on a report OR right click > Open
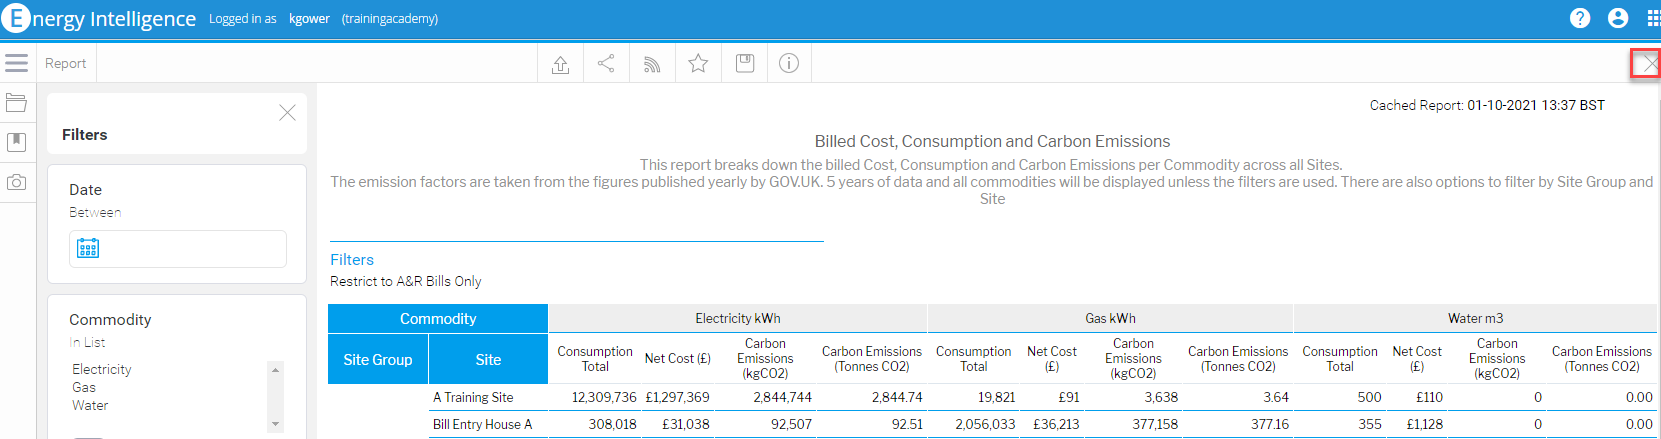
The report will open:
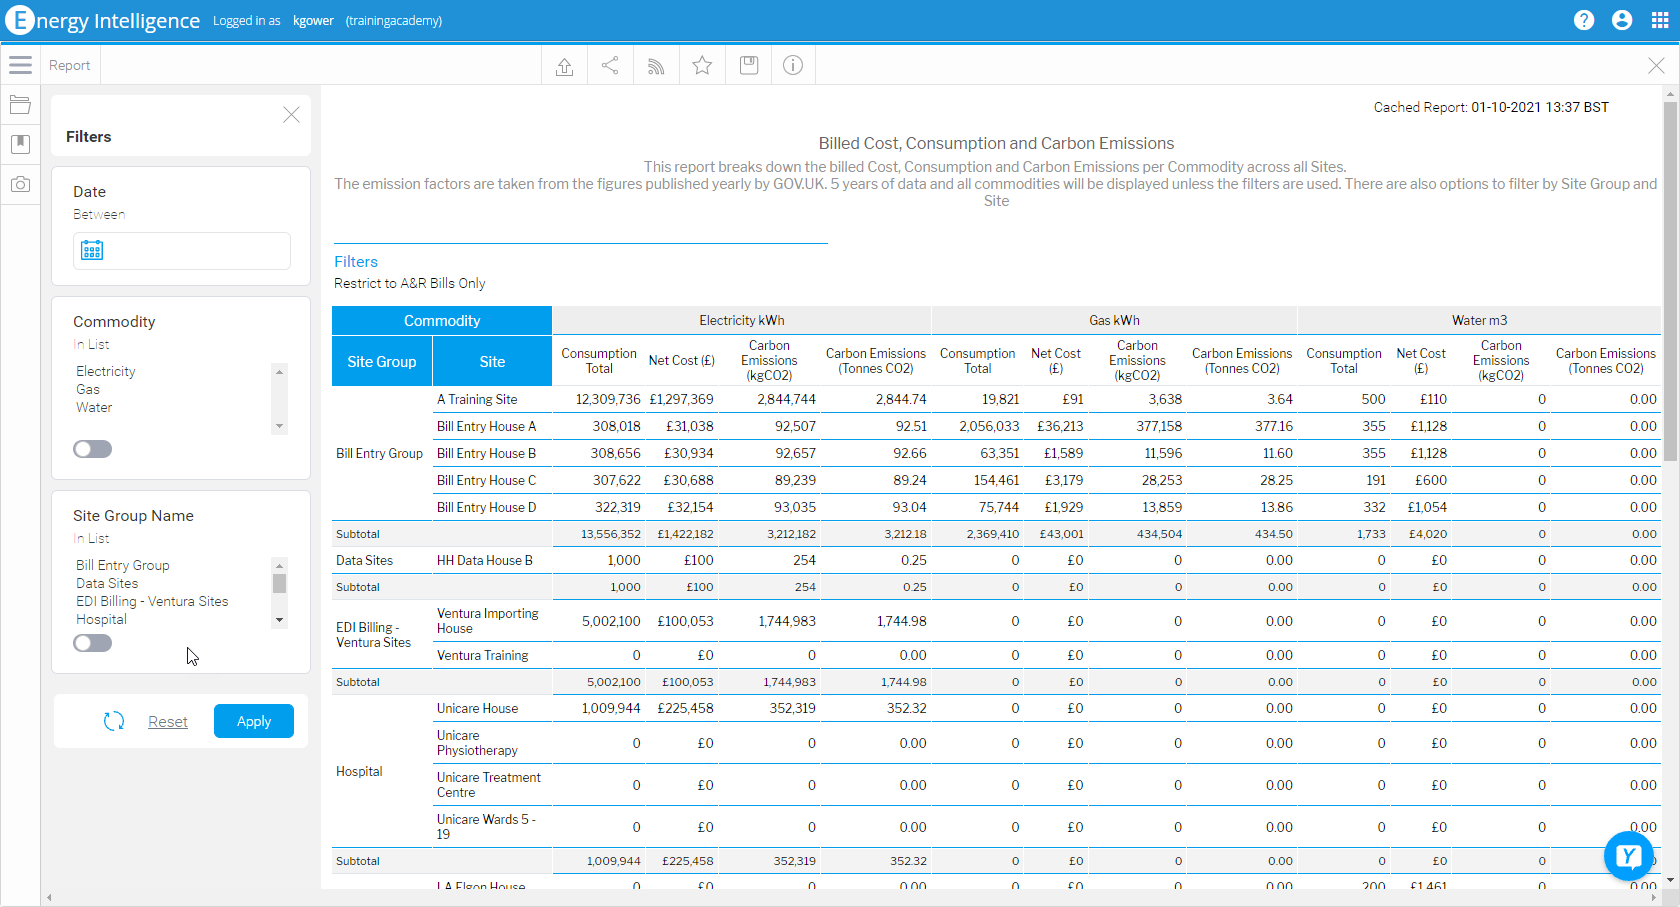
Understanding the Report
Title / Description
The title and description of the report will display at the top of the screen.
- The title and description will help you understand the content of the report and any pre-defined filters

Filtering Options
Understanding the Filtering Options
Some reports will be pre filtered - for example to a specific time year such as The Last Calendar Year - these will have been set up in the background.
Some will also have User filters - these will be usually be displayed on the left hand side. (it is possible for the position of the filters to be changed. Click here for more information.
- Popular Filters include:
- Site Group / Site / Account
- These filters are usually linked so that when you choose a Site Group, the Sites for that Group only are displayed
- Commodity
- Choose one or more Commodities from the list
- Date range
- Choose from either the Calendar or enter the date range OR
- Choose from a pre-defined list showing date ranges such as Last Calendar Month, Today Minus 12 Months, This Financial Year etc
- Site Group / Site / Account
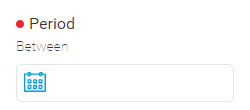
Mandatory Filters
If a report has a mandatory filter, the report will not run until the filter is used.
- An unhappy face will show in the report
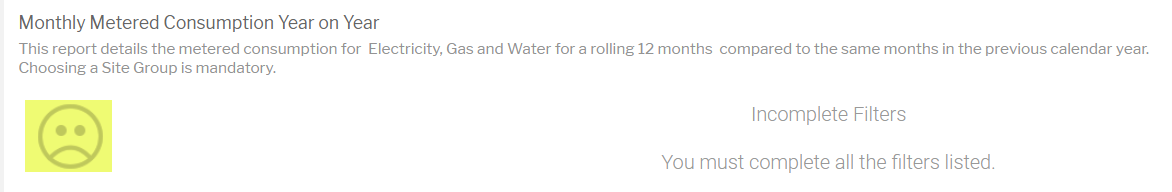
- A mandatory filter will show with a red dot against it. To run the report, you must enter details into the filter
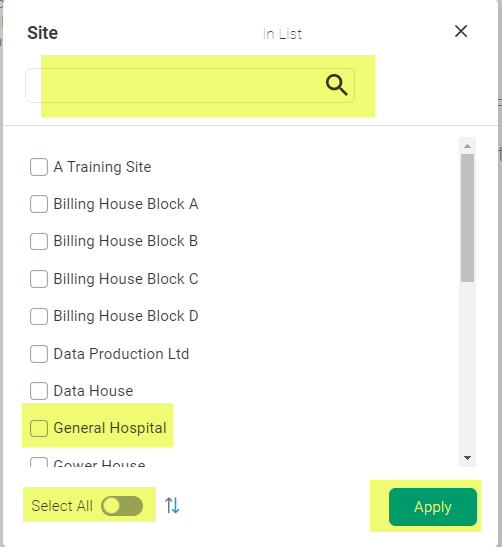
Using the Filtering Options
To see the list of available options:
- Click on the magnifying glass
- From the pop up, search in one of the following ways:
- Enter the criteria into the search field and click on the magnifying glass OR
- Scroll down the list and tick the required Item(s) OR
- Change the slider to Select all the Items
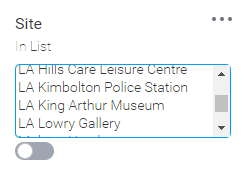
Some reports show a list of Items in the Filtering:
- Tick the Item(s) you want to include in the report OR
- Move the slider to the right to include all
Once you have selected the Filtering Options:
- Click
 and the report will populate
Exporting a Report
Reports can be exported in one of the following ways:
- Exported as a document to Excel, Word etc
- Shared with other users, emailed, embedded into webpages
- Broadcast (scheduled) to be sent to via email on a regular basis
Click here for more information on the above options.
Closing a Report
When you have finished with the report:
- Click on the X in the top right to close the report
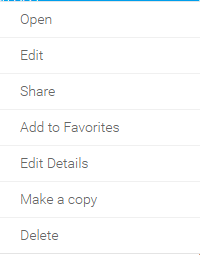
Right Click Options
From the main page (in either thumbnail or list view), you can right click to see the following options:
- Open
- Opens the report
- Edit
- Only available for Users own reports (saved in the Reports folder)
- Share
- Allows you to share with others. Click here for more details
- Add to Favorites
- Adds the report into the My Favorites folder
- Edit Details
- Only available for Users own reports (saved in the Reports folder). Allows you to edit the title and description of the report
- Make a Copy
- Allows you to copy the report, and then save it into the Reports folder
- Delete
- Only available for Users own reports (saved in the Reports folder)
 OR
OR 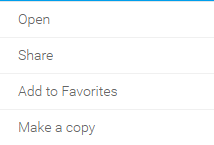
My Favourites Folder
Any report can be marked as a favourite. The report stays in its original folder, but a shortcut is added to the My Favourites folder.
Adding a report to the My Favourites Folder
- From the front page, right click on the report > Add to Favourites OR
- From the report, click
 at the top of the page
Running a Report from the My Favourites Folder
- From the front page of Energy Intelligence, click on the My Favourites folder to see all the reports added as your favourites
Refreshing data in Energy Intelligence
Data is automatically updated overnight, every night. However Users can refresh the data at any point during the day.
- Click here for more information on how to refresh the data
Report Directory
- Click here to view the Report Directory showing a page for each View and details of each report in Energy Intelligence
@ Copyright TEAM - Energy Auditing Agency Limited Registered Number 1916768 Website: www.teamenergy.com Telephone: +44 (0)1908 690018