Sigma Online User Manual
Bills - Charges EI Reports
This page shows Reports that use the Bills - Charges View. The first column has a link that will open the Report in Energy Intelligence.
Click on the link in the table to take you directly into the Report in Energy Intelligence in your own database.
Report Link - click on the link to log into Sigma and view the Report | Thumbnail | Report Description |
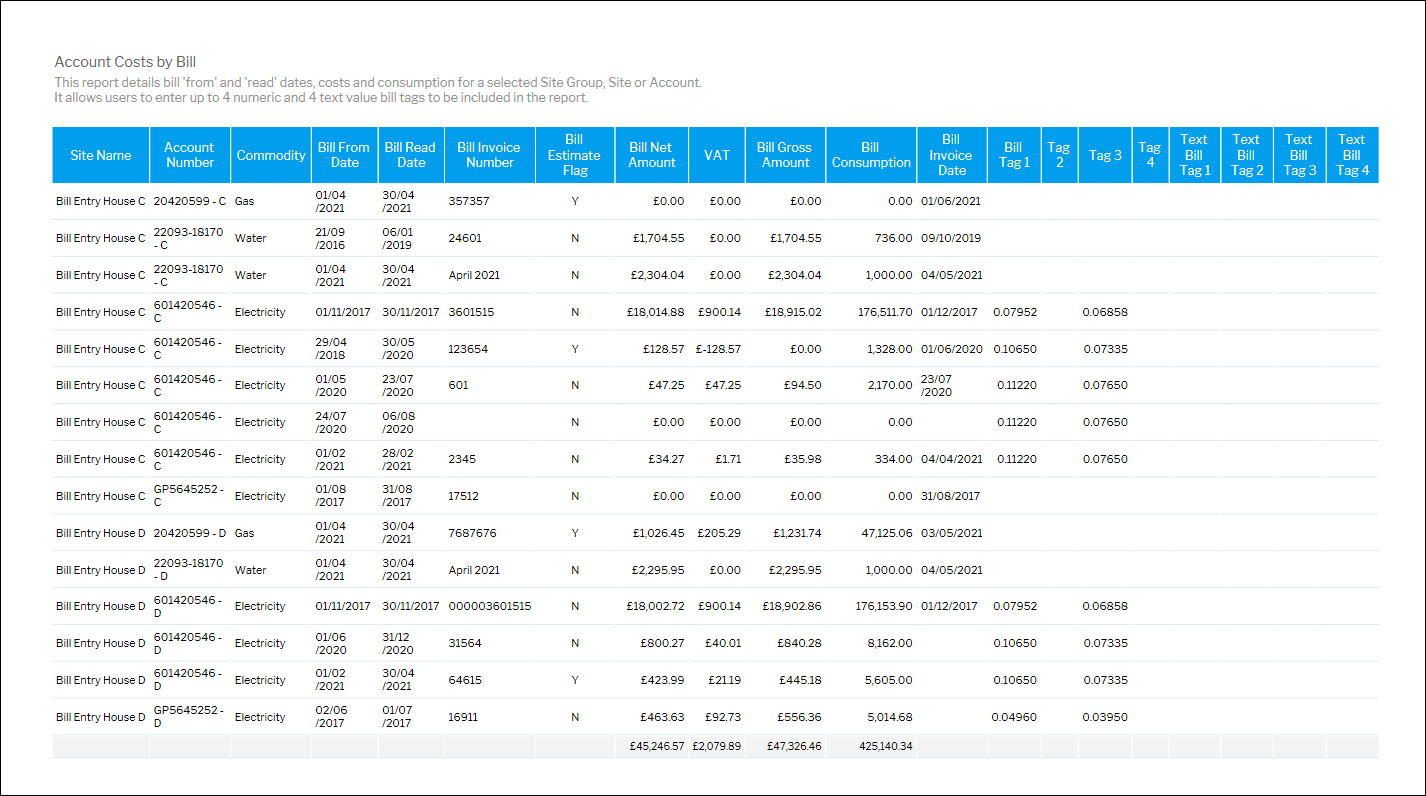
| Account Costs by Bill |
| Account Costs by BillThis report details bill 'from' and 'read' dates, costs and consumption for a selected Site Group, Site or Account. It allows users to enter up to 4 numeric and 4 text value bill tags to be included in the report. |
| Bill Data Dashboard |
| Bill Data DashboardProvides and overview of the number of bills entered in Sigma and the total billed by commodity in the last calendar month |
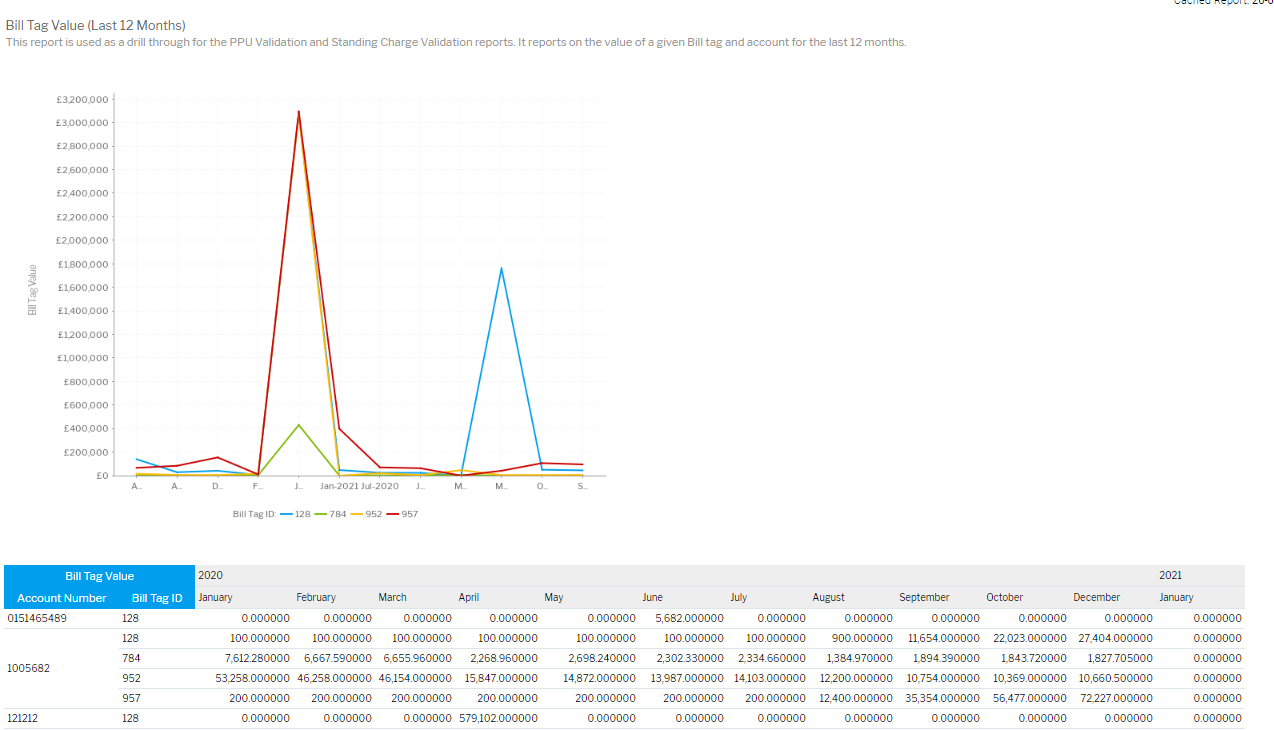
| Bill Tag Value (Last 12 Months) |
| Bill Tag Value (Last 12 Months)This report is used as a drill through for the PPU Validation and Standing Charge Validation reports. It reports on the value of a given Bill tag and account for the last 12 months. |
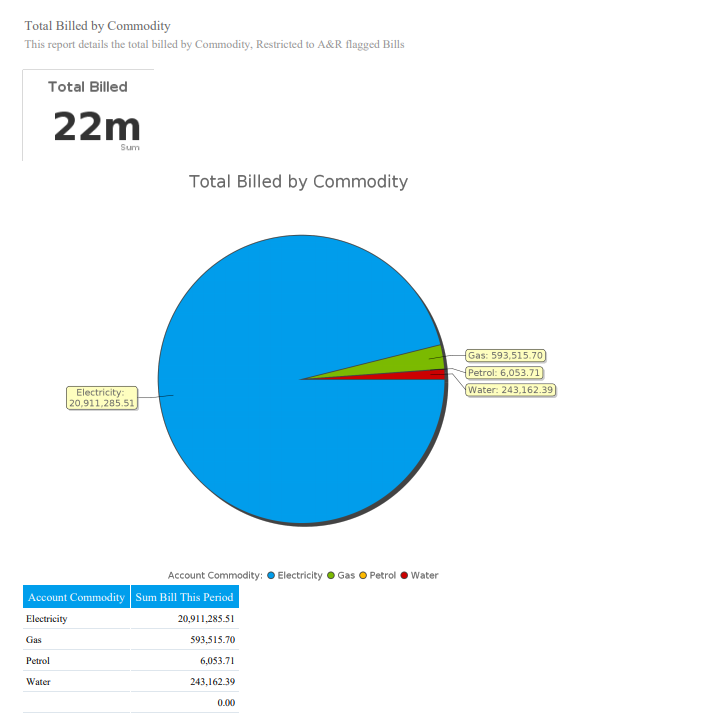
| Billed Cost per Commodity |
| Billed Cost per CommodityDetails the total billed by Commodity. |
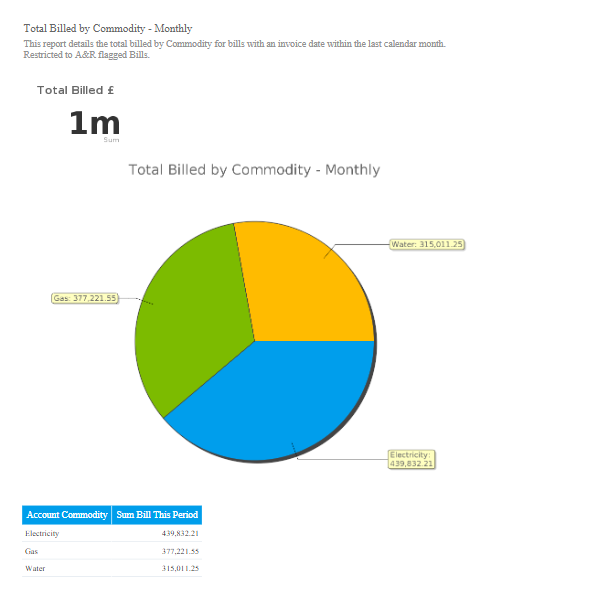
| Billed Cost per Commodity for the last Calendar Month |
| Billed Cost per Commodity for the last Calendar MonthDetails the total billed by Commodity for bills with an invoice date within the last calendar month. |
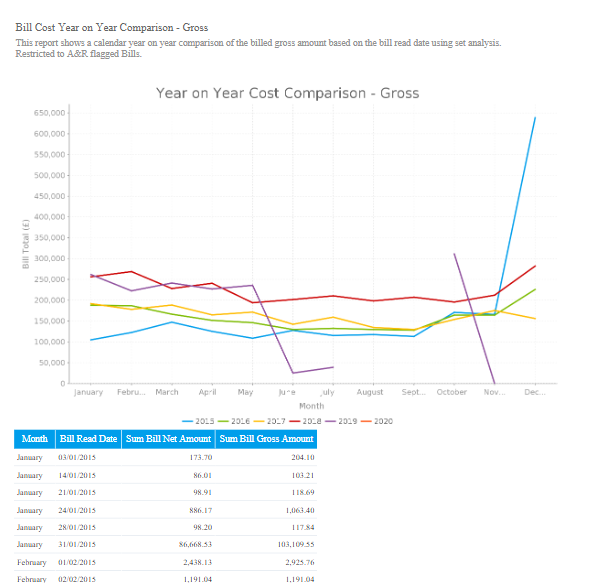
| Billed Cost Year on Year Comparison |
| Billed Cost Year on Year ComparisonShows a calendar year on year comparison of the billed gross amount based on the bill read date using set analysis. |
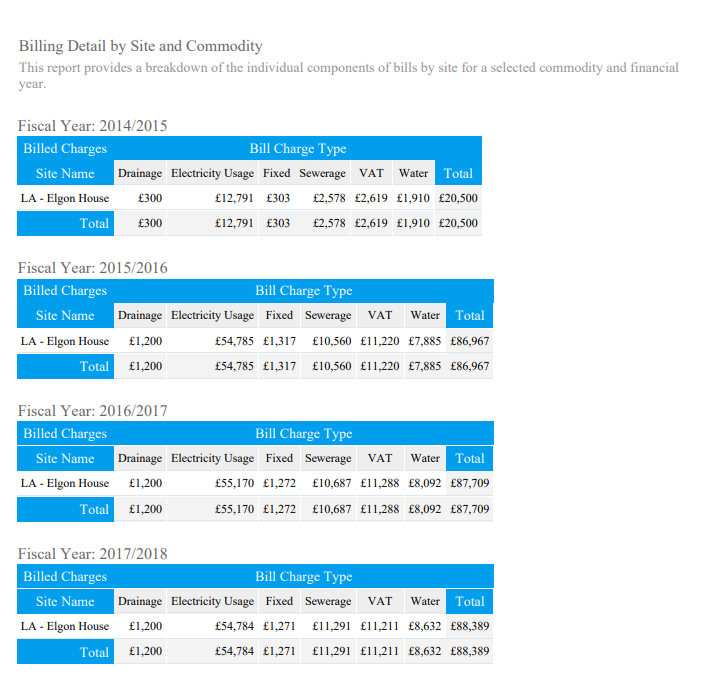
| Billing Detail by Site and Commodity, tabbed in Financial Years |
| Billing Detail by Site and Commodity, tabbed in Financial YearsProvides a breakdown of the individual components of bills by site for a selected commodity and financial year. |
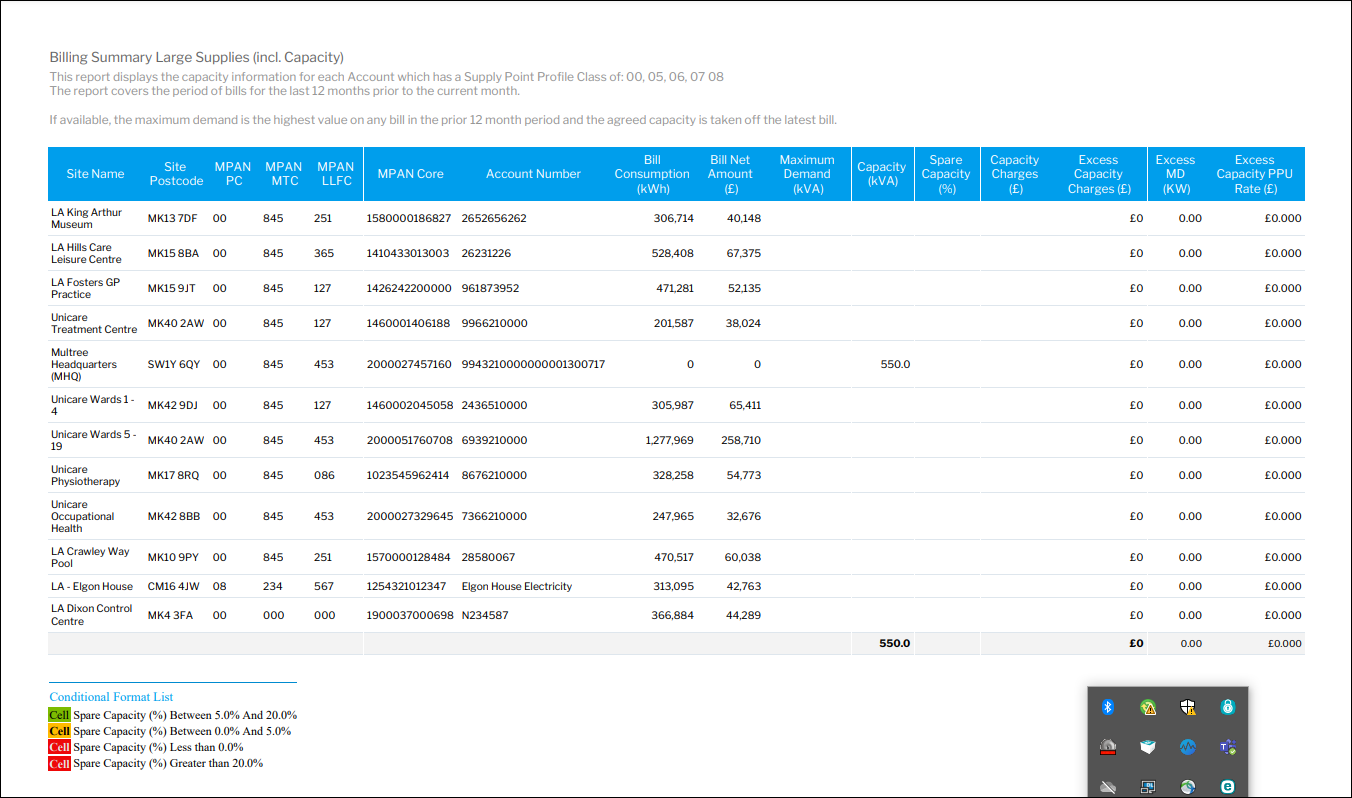
| Billing Summary Large Supplies (incl. Capacity) |
| Billing Summary Large Supplies (incl. Capacity)This report displays the capacity information for each Account which has a Supply Point Profile Class of: 00, 05, 06, 07 08 The report covers the period of bills for the last 12 months prior to the current month. If available, the maximum demand is the highest value on any bill in the prior 12 month period and the agreed capacity is taken off the latest bill. |
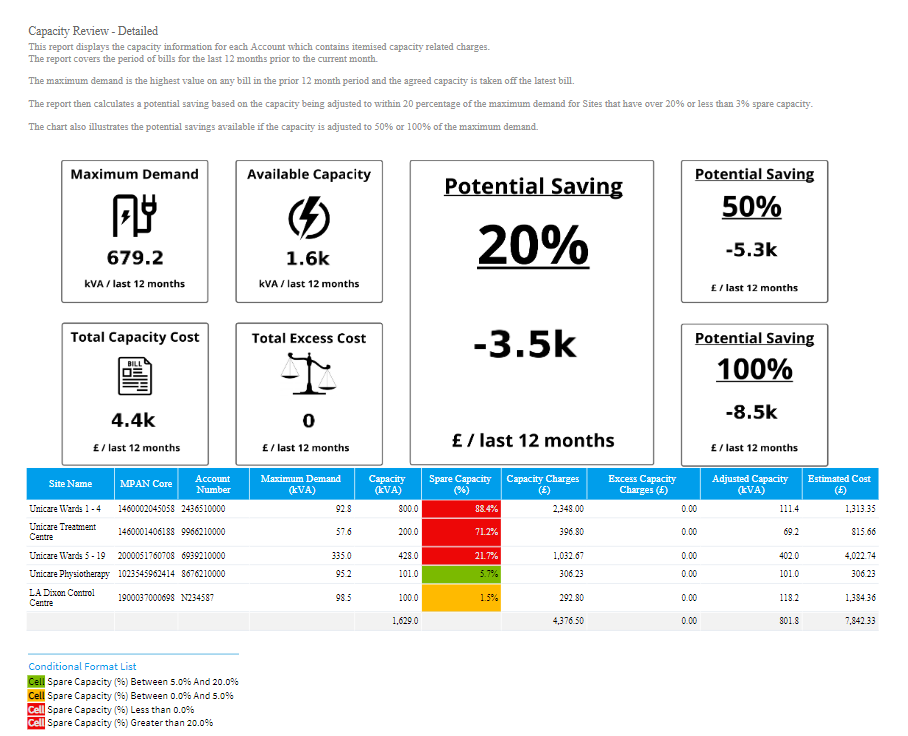
| Capacity Review - Details for 12 months (last month minus 12 months) |
| Capacity Review - Details for 12 months (last month minus 12 months)Displays the capacity information for each Account which contains itemised capacity related charges. |
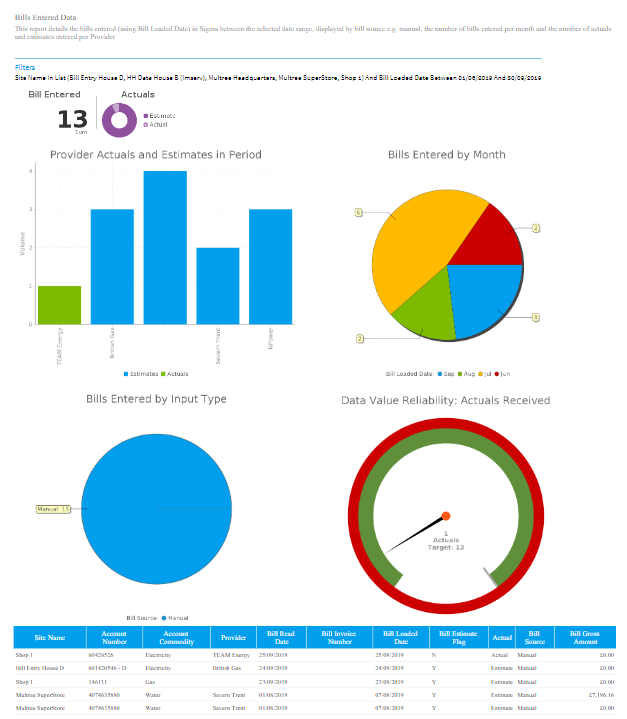
| Details of Bills entered |
| Details of Bills enteredDetails the bills entered (using Bill Loaded Date) in Sigma between the selected date range, displayed by bill source e.g. manual, the number of bills entered per month and the number of actuals and estimates entered per Provider |
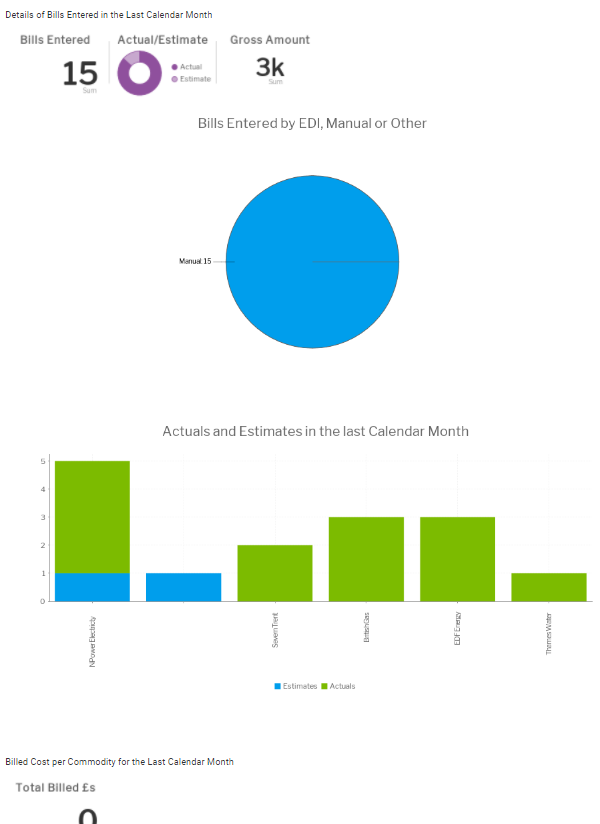
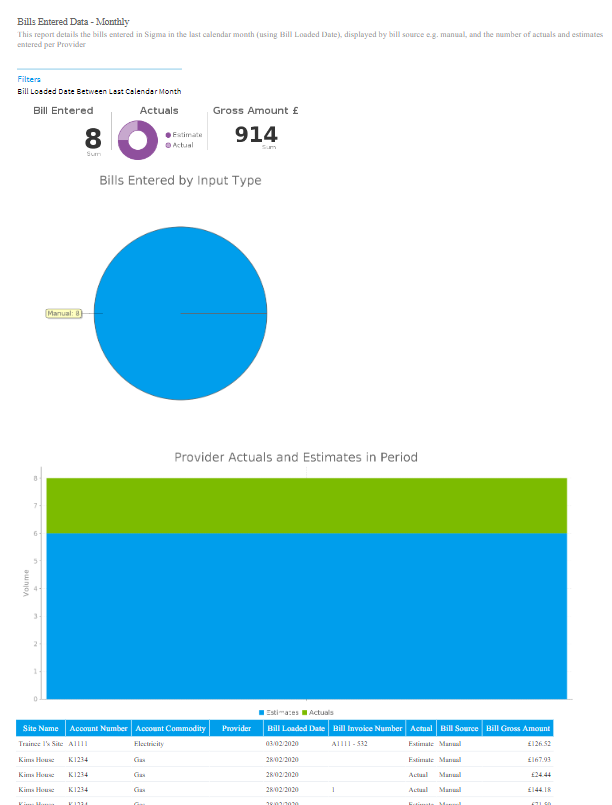
| Details of Bills entered in the last Calendar Month |
| Details of Bills entered in the last Calendar MonthDetails the bills entered in Sigma in the last calendar month (using Bill Loaded Date), displayed by bill source e.g. manual, and the number of actuals and estimates entered per Provider. |
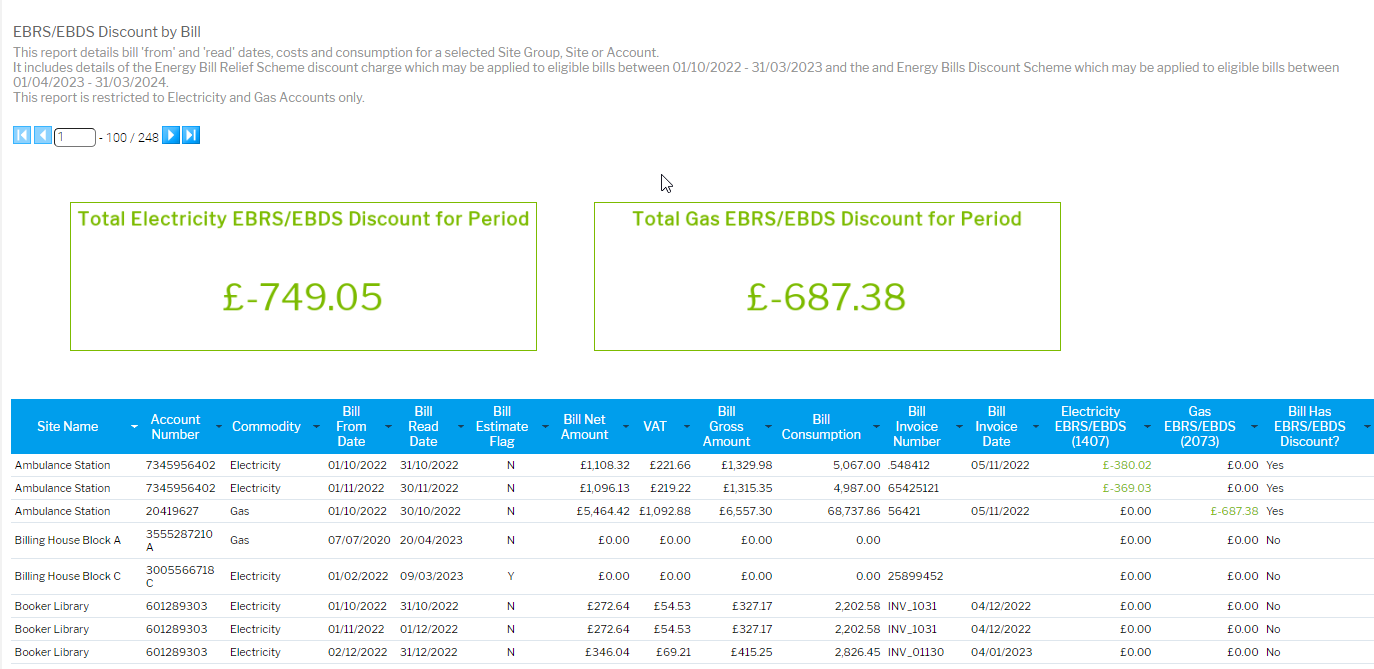
| EBRS/EBDS Discount by Bill |
| EBRS Discount by BillThis report details bill 'from' and 'read' dates, costs and consumption for a selected Site Group, Site or Account. It includes details of the Energy Bill Relief Scheme discount charge which may be applied to eligible bills between 01/10/2022 - 31/03/2023 and the and Energy Bills Discount Scheme which may be applied to eligible bills between 01/04/2023 - 31/03/2024. This report is restricted to Electricity and Gas Accounts only. |
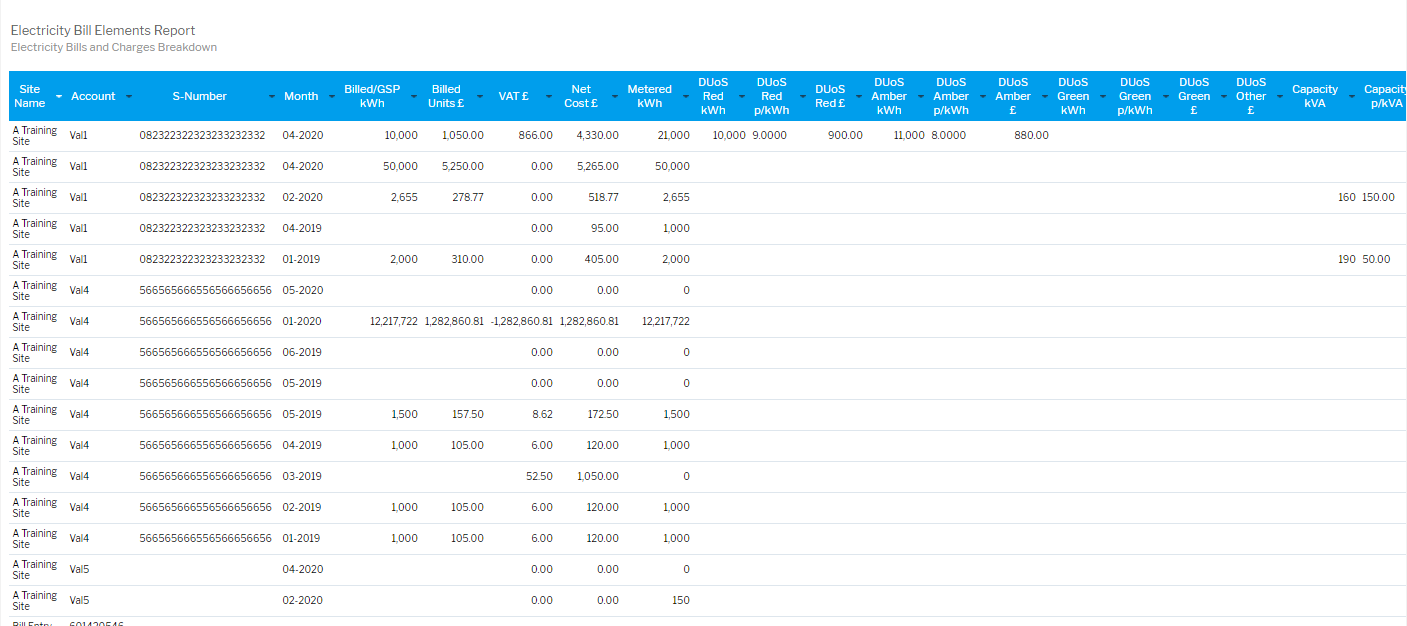
| Electricity Bill Elements Report |
| Electricity Bill Elements ReportElectricity Bills and Charges Breakdown |
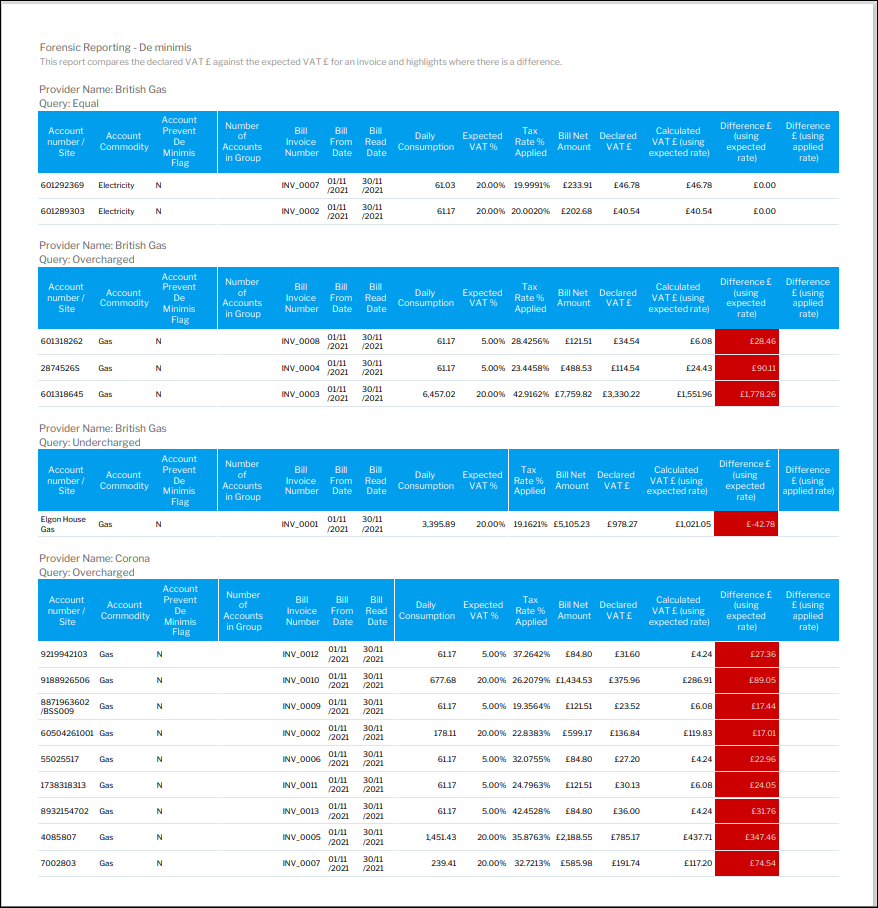
Forensic Reporting - De minimis |
| Forensic Reporting - De minimisThis report compares the declared VAT £ against the expected VAT £ for an invoice and highlights where there is a difference. |
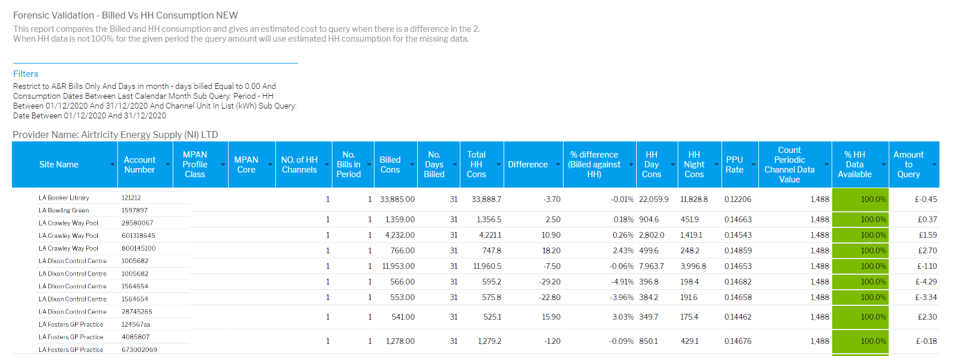
| Forensic Validation - Billed Vs HH Consumption |
| Forensic Validation - Billed Vs HH ConsumptionThis report compares the Billed and HH consumption and gives an estimated cost to query when there is a difference in the 2. |
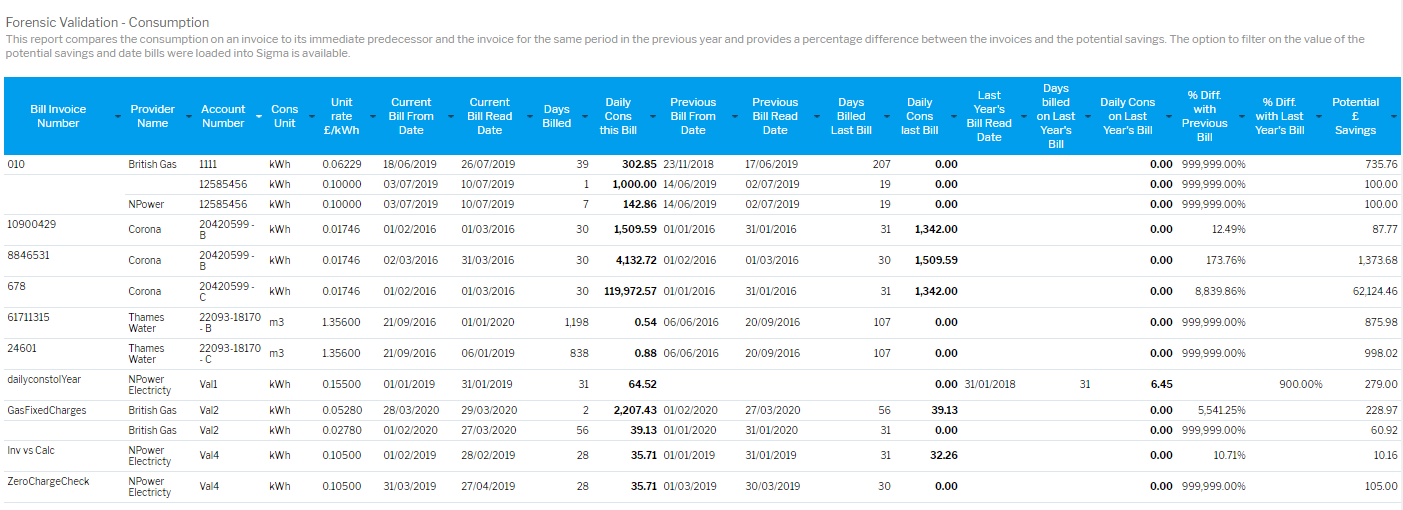
| Forensic Validation - Consumption |
| Forensic Validation - ConsumptionThis report compares the consumption on an invoice to its immediate predecessor and the invoice for the same period in the previous year and provides a percentage difference between the invoices and the potential savings. The option to filter on the value of the potential savings and date bills were loaded into Sigma is available. |
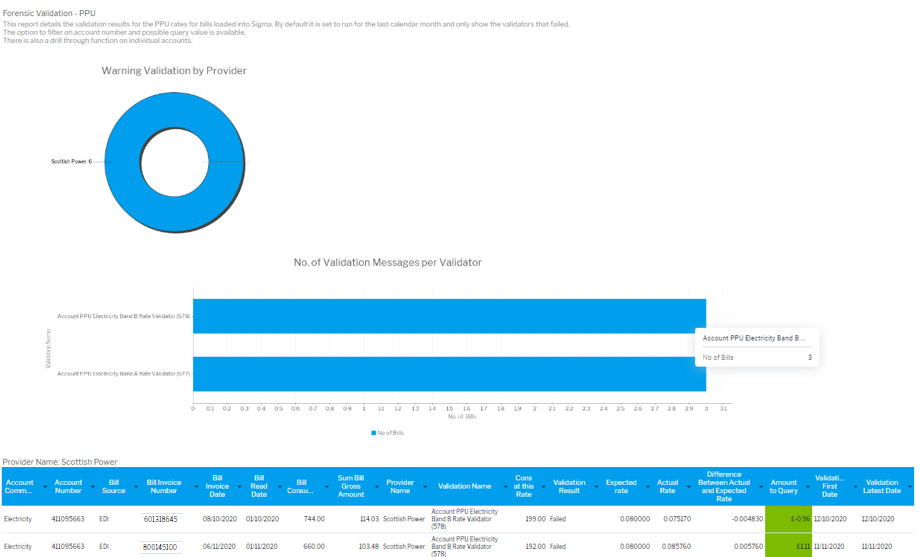
| Forensic Validation - PPU |
| Forensic Validation - PPUThis report details the validation results for the PPU rates for bills loaded into Sigma. By default it is set to run for the last calendar month and only show the validators that failed. |
| Forensic Validation - Standing Charges | 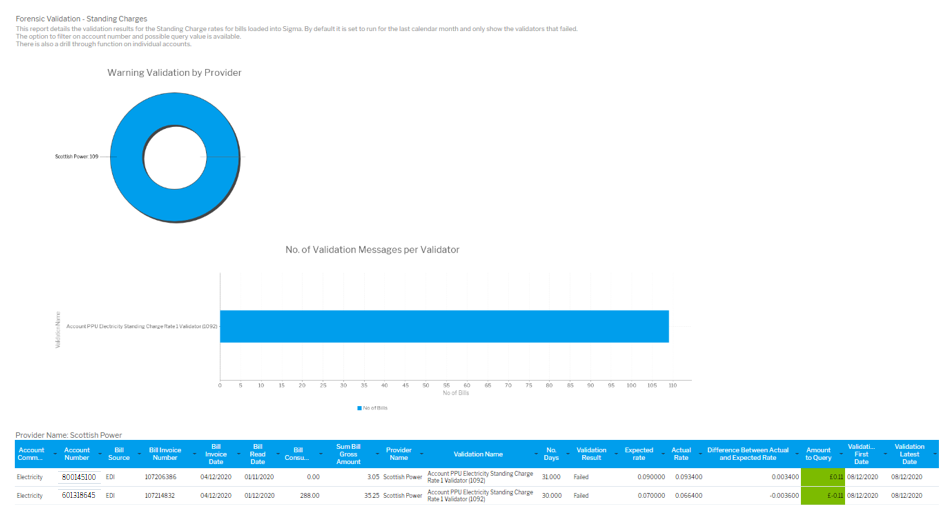 | Forensic Validation - Standing ChargesThis report details the validation results for the PPU rates for bills loaded into Sigma. By default it is set to run for the last calendar month and only show the validators that failed. |
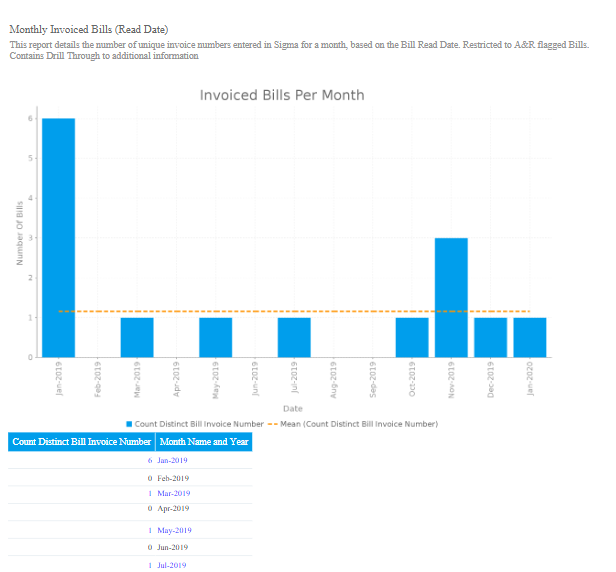
| Number of Invoices billed per Month (by Read date) |
| Number of Invoices billed per Month (by Read date)Details the number of unique invoice numbers entered in Sigma for a month, based on the Bill Read Date |
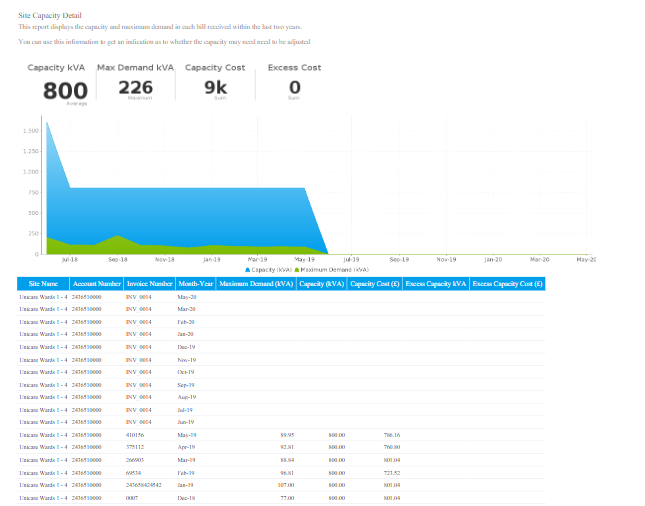
| Site Capacity Detail (per Account)Displays the capacity and maximum demand in each bill received within the last two years. | |
| Sites by Bill Gross Amount Map | Sites by Bill Gross Amount MapThis reports displays a map showing selected sites and the sum of the Bill Gross Amount for a selected month and year. The size of the circle represents the gross amount e.g. the larger the circle, the higher the bill gross amount. Restricted to A&R flagged Bills. | |
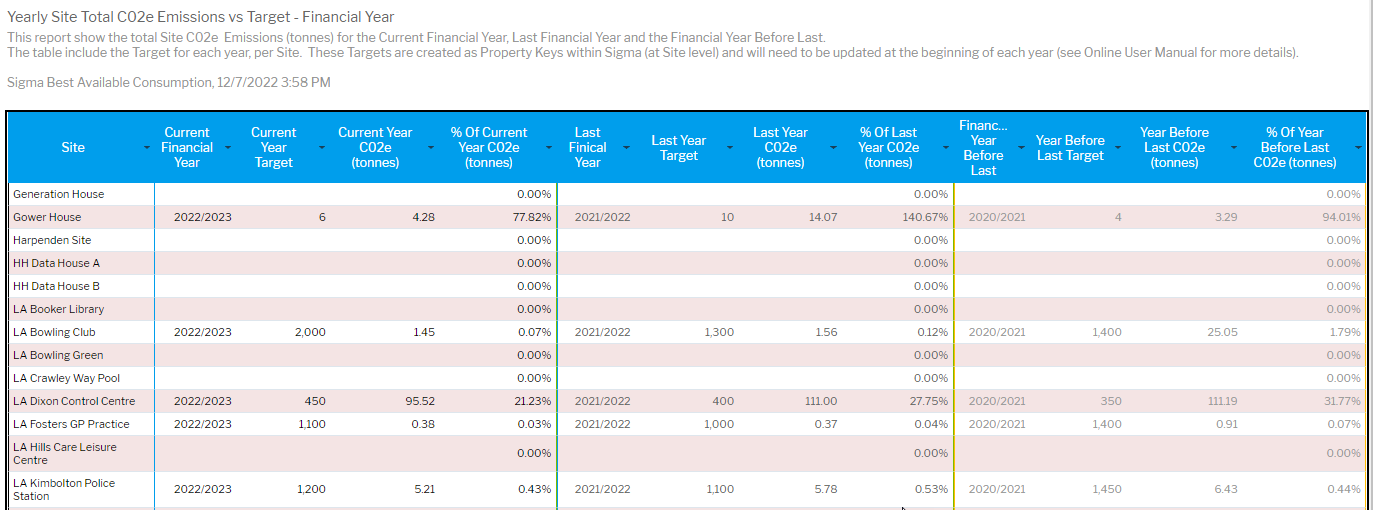
| Yearly Site Total C02e Emissions vs Target - Financial Year |
| Yearly Site Total C02e Emissions vs Target - Financial YearThis report show the total Site C02e Emissions (tonnes) for the Current Financial Year, Last Financial Year and the Financial Year Before Last.
The Targets are created in Sigma as Property Keys and need to be updated at the beginning of each year. Click here for details on how to update the Property Keys. |
@ Copyright TEAM - Energy Auditing Agency Limited Registered Number 1916768 Website: www.teamenergy.com Telephone: +44 (0)1908 690018