Being able to identify potential problems with your utility usage is absolutely critical to help you manage your energy effectively and help detect avoidable waste. The idea is that you set-up a number of monitoring strategies to notify you whenever an unusual pattern is identified on your periodic channels. This is useful in being able to efficiently determine where your energy usage has gone off trend so that investigative or corrective action can be taken quickly to prevent the exception from happening again and avoid potential waste.
A dynamic profile is where recent data is compared with preceding historical data to determine whether the recent usage might be suspect - i.e. the usage has gone 'off trend'. This is commonly known as precedent based targeting. The system will automatically review the data to notify you of these issues to help prompt proactive investigation to determine whether anything needs to change to bring usage back to something more normal. The sensitivity of these checks and how often they should be performed is entirely configurable. This is often referred to as "spike" or "drop" identification.
For example:
- every Monday for the past four weeks has used an average of 100 kWh, but the latest Monday has used 150 kWh.
- the weekly consumption for the previous 2 weeks has been 12,000 kWh, but last week was 15,000 kWh
Adding a Dynamic Profile Strategy
Monitoring Strategy Details
This basic workflow allows you to capture information and update the status of the Notifications, as per your own business processes. This is expected to be used to help you keep track of any investigative and follow-up actions which are been taken as a result of the Data Monitoring Notifications. For example: Highlight the Notification(s) you would like to update. Notifications can be selected in bulk, even across different strategy types. The Status will default to In Progress and is not editable - the Resolve and Ignore features will update the status. If you want to update the Sub-status, select the required option from the drop down list. The default options are: Pending Resolution You can customise the options available for selection to suite your needs here by using the Database Object Setup activity. You can also create reports in Energy Intelligence to keep track of the Notifications and their status, filtered as required to show the information as per your needs. If you want to update the Note for the Notification(s), then Tick Update Note and enter the note in the text box. Click OK to Save. This will update the status of the Notification to "Ignored" and will also prevent the same notification (for the same period and Impact) from being raised by the system again. If you want to update the Note for the Notification(s), then Tick Update Note and enter the note in the text box. You can view the Channel / amend the interval reading Data associated to the notification, if required. Please note, this option is only available if a single Notification is selected. Highlight the Notification for which you would like to edit the underlying monitoring strategy configuration.Adding Notes to Notifications
 which will display the Work Notification pop up:
Ignoring Notifications
 to open the Ignore Notifications pop up appears:
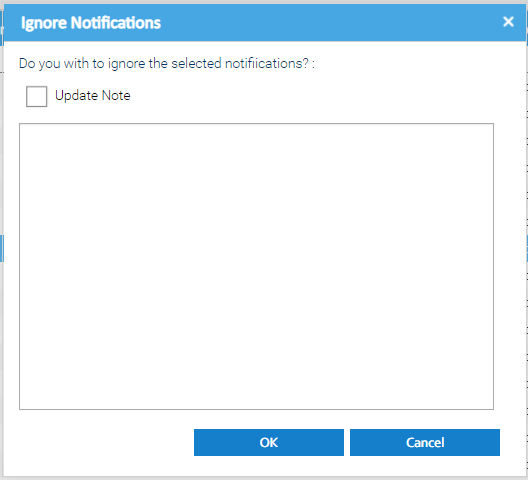
Editing Items
 to open the Periodic HFD Channel Editor
 Editing Monitoring Strategies
 to open the Monitoring Strategy Editor. Note, this is only an available option if Notification(s) relating to a single strategy are selected.
Exporting to Excel
 to download an Excel Spreadsheet of everything you see in the table
Dynamic Profile Configuration
The Monitoring Strategy Editor also contains an Dynamic Profile Configuration section that allows you to set the specific configuration to use when finding and managing your data.
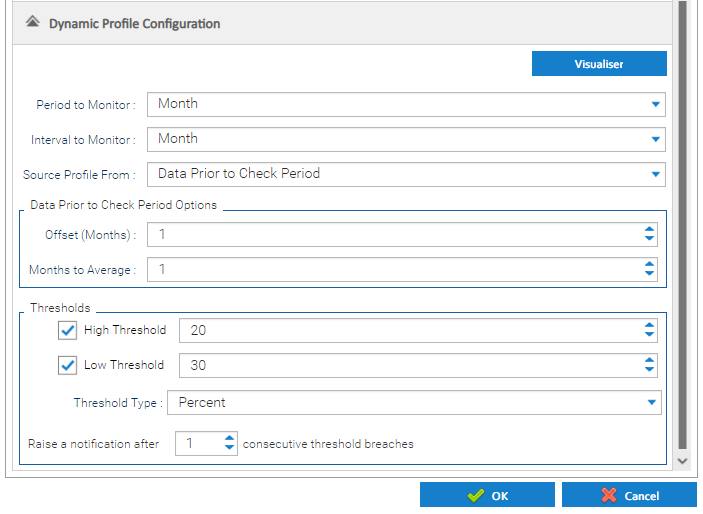
The settings entered here will control how recent data is compared with previous data to determine whether there is an issue. Ultimately, these options provide you with the tools to choose the granularity you want the check to be performed (e.g. aggregated week / day / hour aggregation or half-hourly) and what the system should use as historical data to compare that against.
Whilst each of the fields are explained below in more detail, please click here to jump to a table that provides a some example configurations and (e.g. I want to check a days behaviour with the behaviour on the same days over the last 2 weeks).
| Field | Default | Description |
|---|---|---|
| Period to Monitor | Month | This represents the period of time you want to compare to. Combined with the offset that can be defined, this will determine what the latest data will be compared to. Choose from:
Please note, the period to Monitor selected will drive at what point in time the system will perform the checks and how it determines the latest period of time that is being checked.
|
| Interval to Monitor | Month | This represents the interval within that period that you wish to monitor. The options available in the dropdown will depend on the Period to Monitor that has been chosen. Period: Year
Period: Month
Period: Week
Period: Day
|
| Source Profile From | Data Prior to Check Period | Choose from:
|
Data Prior to Check Period is chosen... compare recent data against the period of time directly prior to the period being checked. | ||
| Offset (<period selected>) | 1 | Specifying a number greater than one here specifies an offset as to how many prior periods should be skipped when determining the period of time to compare the recent behaviour against. By default this would be "1" and this means:
Some examples where the offset may be changed to something other than "1":
|
| <period selected> to Average | 1 | This will define the number of prior periods of time that will be used to derive an average profile which the recent data can then be compared to to determine if it is suspect or not. For example if the period selected is:
|
Data Ending on a Fixed Date is chosen... compare recent data against the period of time directly prior to the end date that has been specified. | ||
| Fixed Date | Current Date | Amend the Fixed date using the arrows or the calendar |
| <period selected> to Average | 1 | As above - it will average the period directly prior to the period ending that has been specified. |
| Thresholds | ||
| High Threshold | 20 | Use the tickbox to the left of the High Threshold label to enable/disable the high threshold check. The value entered here is effectively the sensitivity of the upper limit that is permitted when the recent data is compared against the historical data (i.e. where the data spikes). This should be considered in conjunction with the type of threshold listed below. |
| Low Threshold | 30 | Use the tickbox to the left of the Low Threshold label to enable/disable the low threshold check. The value entered here is effectively the sensitivity of the lower limit that is permitted when the recent data is compared against the historical data (i.e. where the data drops). This should be considered in conjunction with the type of threshold listed below. |
| Threshold Type | Percent | Choose from:
|
| Raise a notification after X consecutive breaches | 1 | This setting allows you to control how sensitive the check is and whether it should only alert you if the issue is a consistent problem. For example, you maybe performing a daily check against the same day last week. You might only want it to tell you if a problem is found 2 days in a row, in this case this would be set to "2". |
Click OK to save the Monitoring Strategy.
Example Configurations
The table below provides a summary of the different configuration options are available to help clarify how the system can be setup to perform the various checks for you, and what they actually mean.
| I want to be able to... | Period | Interval | Source Profile from | Offset | <Period> to average | Notes |
|---|---|---|---|---|---|---|
| compare the consumption for the last full year with the average of the 1 year(s) prior | Year | Year | Data Prior to Check Period | 1 | 1 | Change the <period to average> to compare the latest year against the average of the preceding <x> years. |
| compare the consumption for the last month with the same month last year | Month | Month | Data Prior to Check Period | 12 | 1 | |
| compare the consumption for the last month with the average of the preceding 3 month(s) | Month | Month | Data Prior to Check Period | 1 | 3 | Change the <period to average> to compare the latest month against the average of the preceding <x> months. |
| compare the consumption for the last week with the average of the preceding 1 week(s) | Week | Week | Data Prior to Check Period | 1 | 1 | Change the <period to average> to compare the latest week against the average of the last <x> weeks. |
| compare the consumption for each day of the last week with the average of the same day for the preceding 2 weeks | Week | Day | Data Prior to Check Period | 1 | 2 | Change the <period to average> to compare each day against the average of the equivalent day in the preceding <x> weeks. |
| compare the consumption for each half hour with the average of the same half hour in the preceding 4 weeks | Week | Half Hour | Data Prior to Check Period | 1 | 4 | Change the <period to average> to compare the latest week against the average of the equivalent period in the last <x> weeks. |
| compare the consumption for each day with the average of the preceding day(s) | Day | Day | Data Prior to Check Period | 7 | 1 | Change the <period to average> to compare the latest day against the average of the previous <x> days. |
| compare the consumption for each half hour of the day with the average of the equivalent half hour(s) in the preceding 2 days | Day | Half Hour | Data Prior to Check Period | 7 | 2 |
Dynamic Profile Notifications
Notifications will be raised that are visible in the Notifications Tab of Data Monitoring.
Each notification will provide key details about the potential problem that has been found. For example, it will include details of the start and end time of the problem and the impact of the the issue (in the units of the applicable channel). The impact is the deviation between the actual usage and the expected usage as per the tolerances that have been set. This will help you identify the problems that have the largest impact and may need following up sooner.
Resolving Dynamic Profiles
The "Resolve" functionality ultimately allows you view the potential problem that has been raised in the context of the surrounding data - the problem periods will be clearly highlighted in red, helping you to visualise the impact.
Highlight the applicable Dynamic Profile Notification(s) in the list.
Click  to open the Resolve Notifications popup
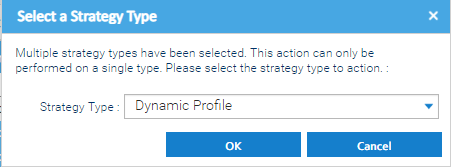
If you select notifications which include types other than gaps, then a prompt will be displayed to confirm which strategy type you want to work with as the options available are contextual to the type of data issue being worked.
The Resolve Notifications popup will be displayed, showing a list of the Notifications selected for resolution.
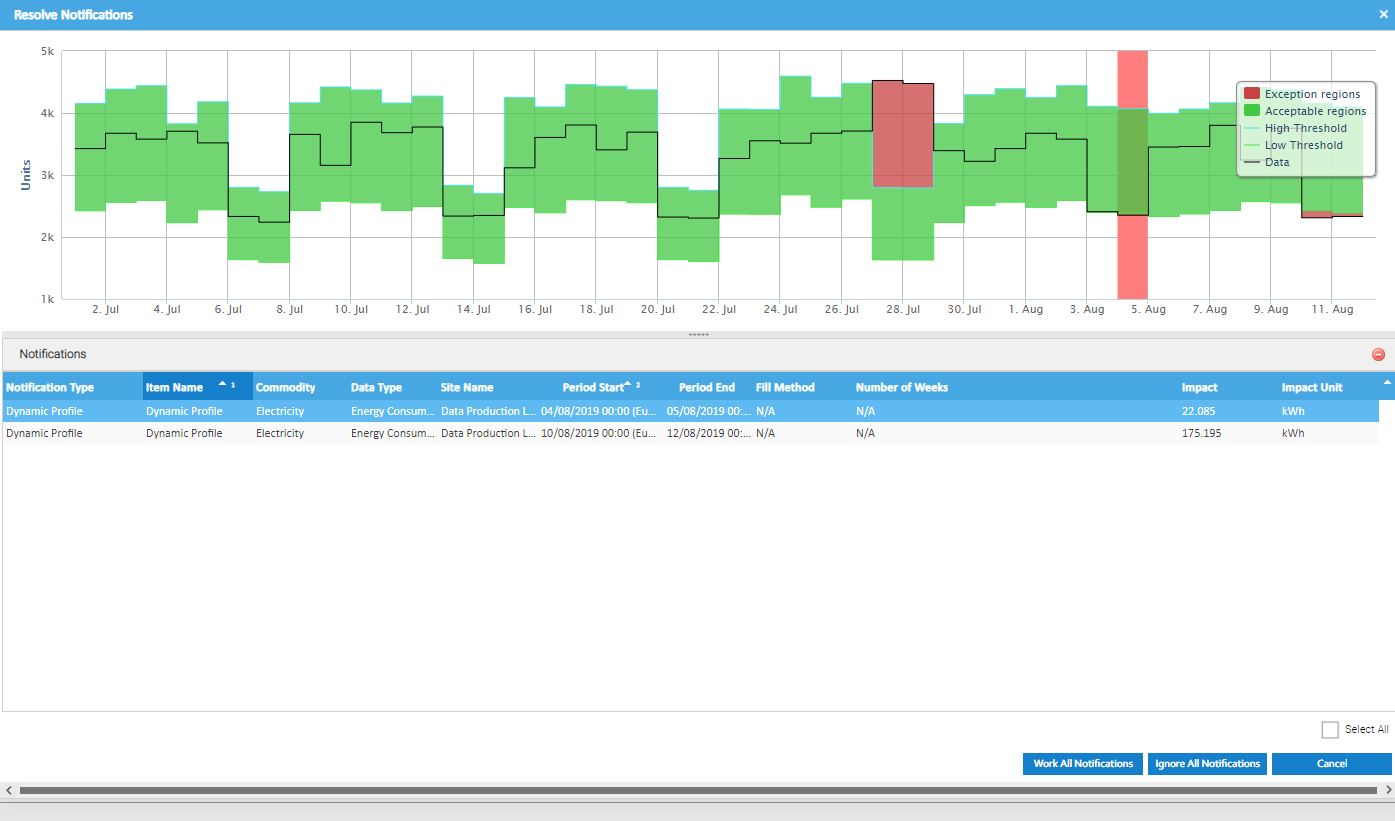
The graph at the top shows the profile for the first Notification in the list. Click on others in list to see the graph for that particular Dynamic Profile.
The graph has 5 areas:
- Black line - the actual channel data
- Green line - the acceptable lower threshold that has been calculated based on the settings in the data monitoring strategy
- Blue line - the acceptable upper threshold that has been calculated based on the settings in the data monitoring strategy
- Green area - acceptable region (i.e. the area between the acceptable upper and lower region)
- Red area - exception region (i.e. the area between the actual data line and the acceptable upper or lower threshold regions)
The different components of the graph can be enabled or disabled, just click on the different items in the legend which sits on top of the graph on the right hand side.
Drag the mouse around the area to zoom in
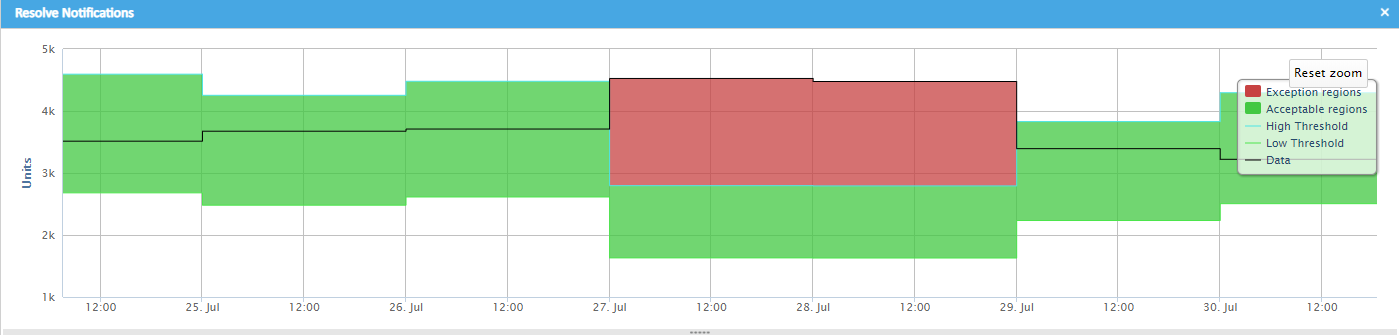
Click  to reset the zoom back to the default.
Actions - Dynamic Profile
Work All Notifications
Click  which will display the Work Notification pop up:
The Status will default to In Progress and is not editable - the Resolve and Ignore features will update the status.
If you want to update the Sub-status, select the required option from the drop down list. The default options are:
- Under Investigation
- Assigned to Third Party
- Pending Resolution
You can customise the options available for selection to suite your needs here by using the Database Object Setup activity.
You can also create reports in Energy Intelligence to keep track of the Notifications and their status, filtered as required to show the information as per your needs.
If you want to update the Note for the Notification(s), then Tick Update Note and enter the note in the text box.
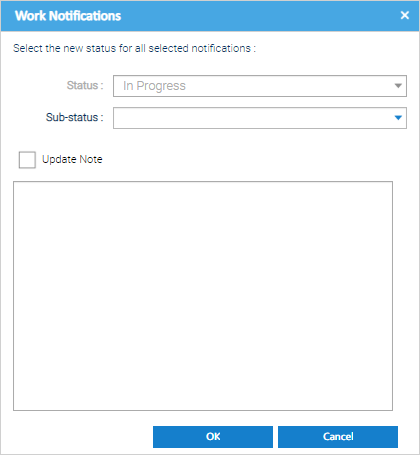
Click OK to Save.
Ignore All Notifications
Tick  , then click
  to ignore all Notifications.
Ignoring a notification will make sure you are not notified of the same issue again for the same period of time.
Cancel
Click to return to the Data Monitoring Activity to show a list of the Notifications as per the filter criteria that was previously set.