This page shows examples of the Reports using the Metered Consumption Data View, along with a link to take you to the Report in your Energy Intelligence.
Click on the link in the table to take you directly into the Report in Energy Intelligence in your own database.
Report Link - click on the link to log into Sigma and view the Report | Thumbnail | Report Description |
| Daily Metered Consumption for the Previous Calendar Month vs the same Period Last Year |
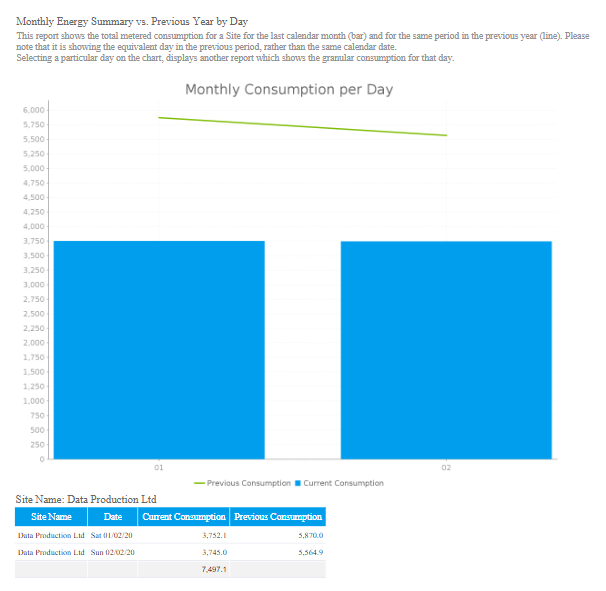
| Daily Metered Consumption for the Previous Calendar Month vs the same Period Last YearShows the total metered consumption for a Site for the last calendar month (bar) and for the same period in the previous year (line). Please note that it is showing the equivalent day in the previous period, rather than the same calendar date. |
| Days since last Meter Reading |
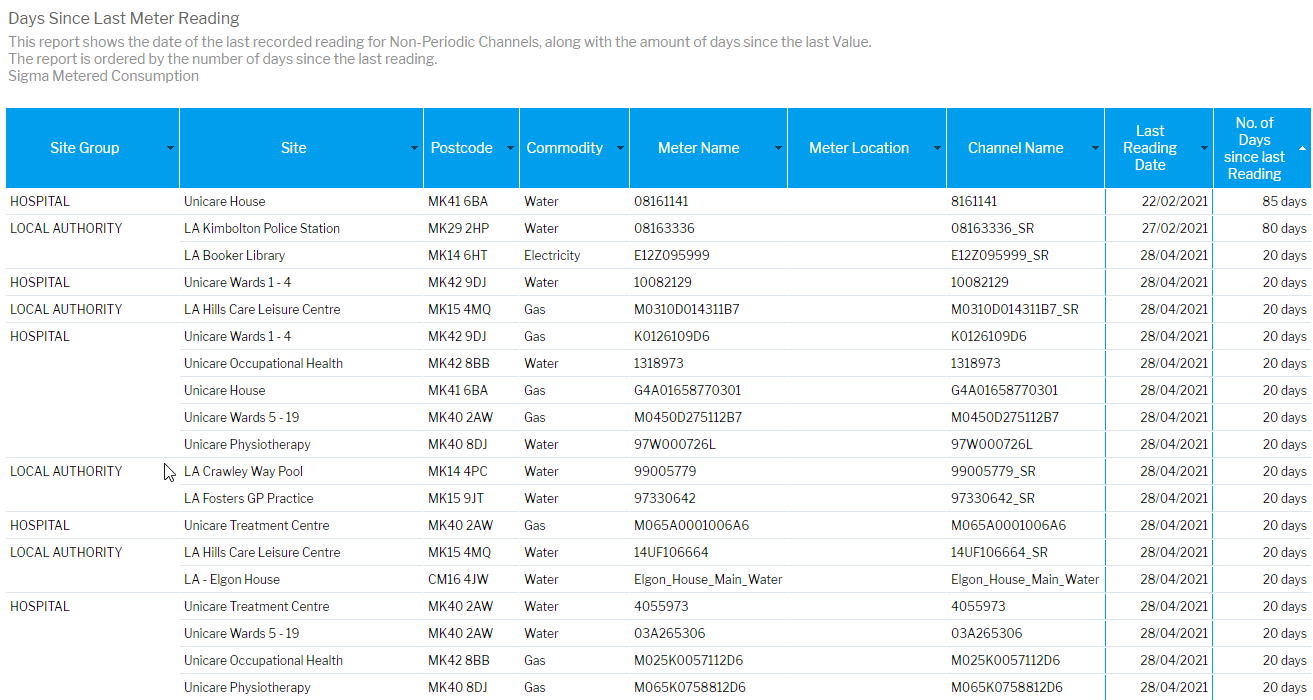
| Days since last Meter ReadingThis report shows the date of the last recorded reading for Non-Periodic Channels, along with the amount of days since the last Value. The report is ordered by the number of days since the last reading. |
| General Graph and Table for Metered Consumption |
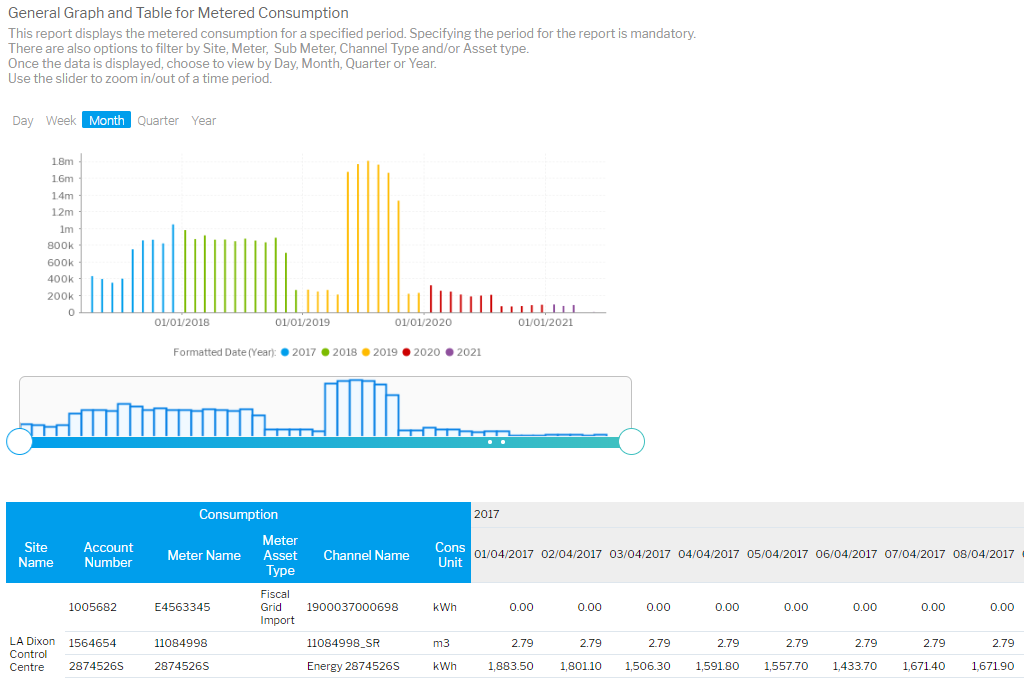
| General Graph and Table for Metered ConsumptionThis report displays the metered consumption for a specified period. Specifying the period for the report is mandatory. There are also options to filter by Site, Meter, Sub Meter, Channel Type and/or Asset type. Once the data is displayed, choose to view by Day, Month, Quarter or Year. Use the slider to zoom in/out of a time period. |
| Metered Consumption Vs Sub Meter Consumption |
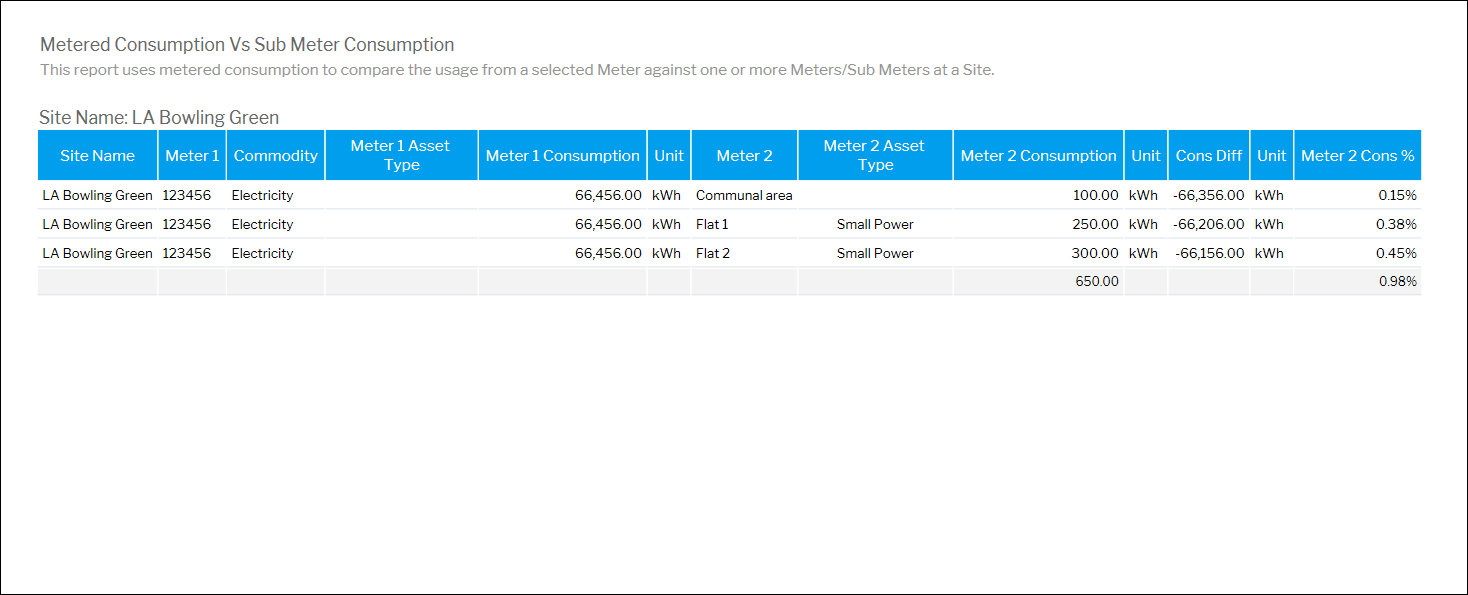
| Metered Consumption Vs Sub Meter ConsumptionThis report uses metered consumption to compare the usage from a selected Meter against one or more Meters/Sub Meters at a Site. |
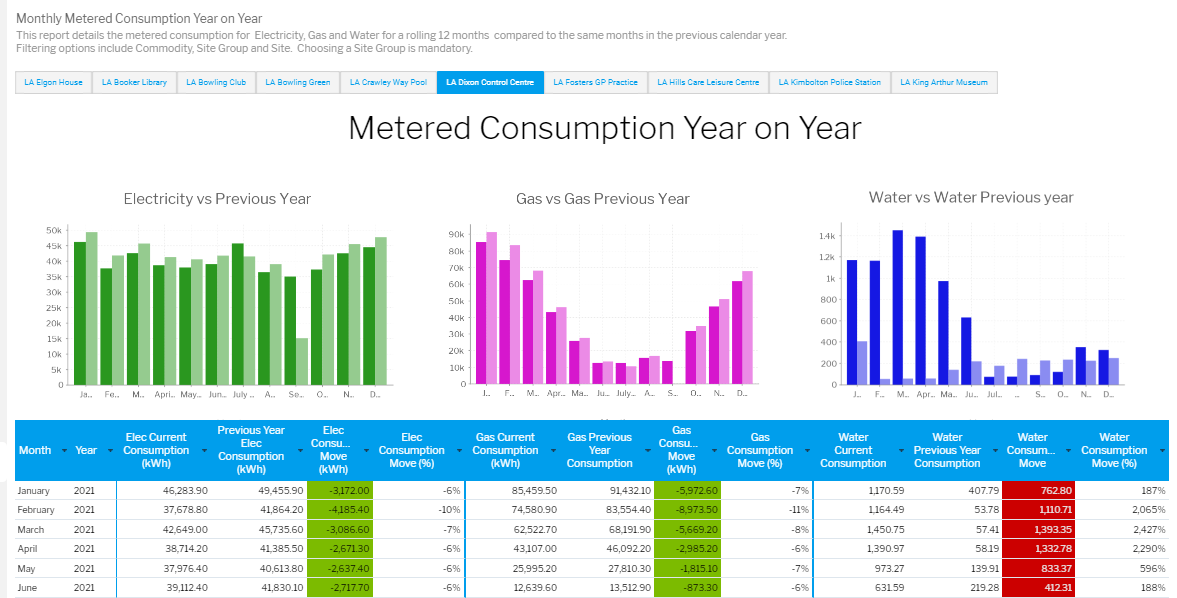
| Monthly Metered Consumption Year on Year |
| Monthly Metered Consumption Year on YearThis report details the metered consumption for Electricity, Gas and Water for a rolling 12 months compared to the same months in the previous calendar year. Filtering options include Commodity, Site Group and Site. Choosing a Site Group is mandatory. |