...
- This report was run in April 2020 so there are two columns for April as part of the month is historic (up to today) and the other is forecasted (up to the end of April)
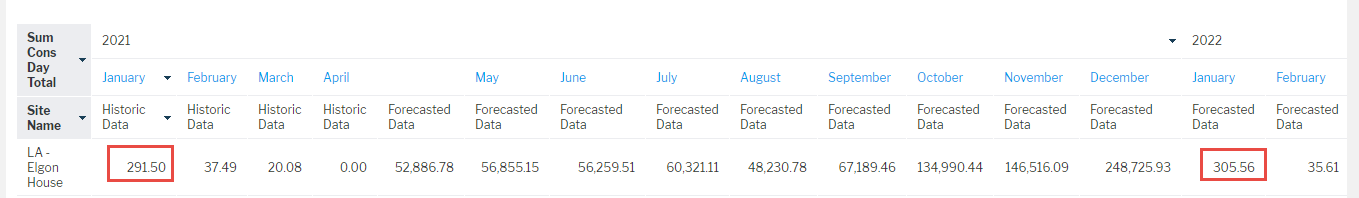
- To compare the Historic Data and the Forecasted Data, look at the figures for January 2021 and January 2022
- The consumption will vary from year to year due to the Data Mapping techniques used in Energy Intelligence

Emissions Dashboard
...