...
Opening the Site Summary Tab
- Open the Estate Management Activity.
- Highlight a Site in the Data Selector to see the Site Summary Tab.

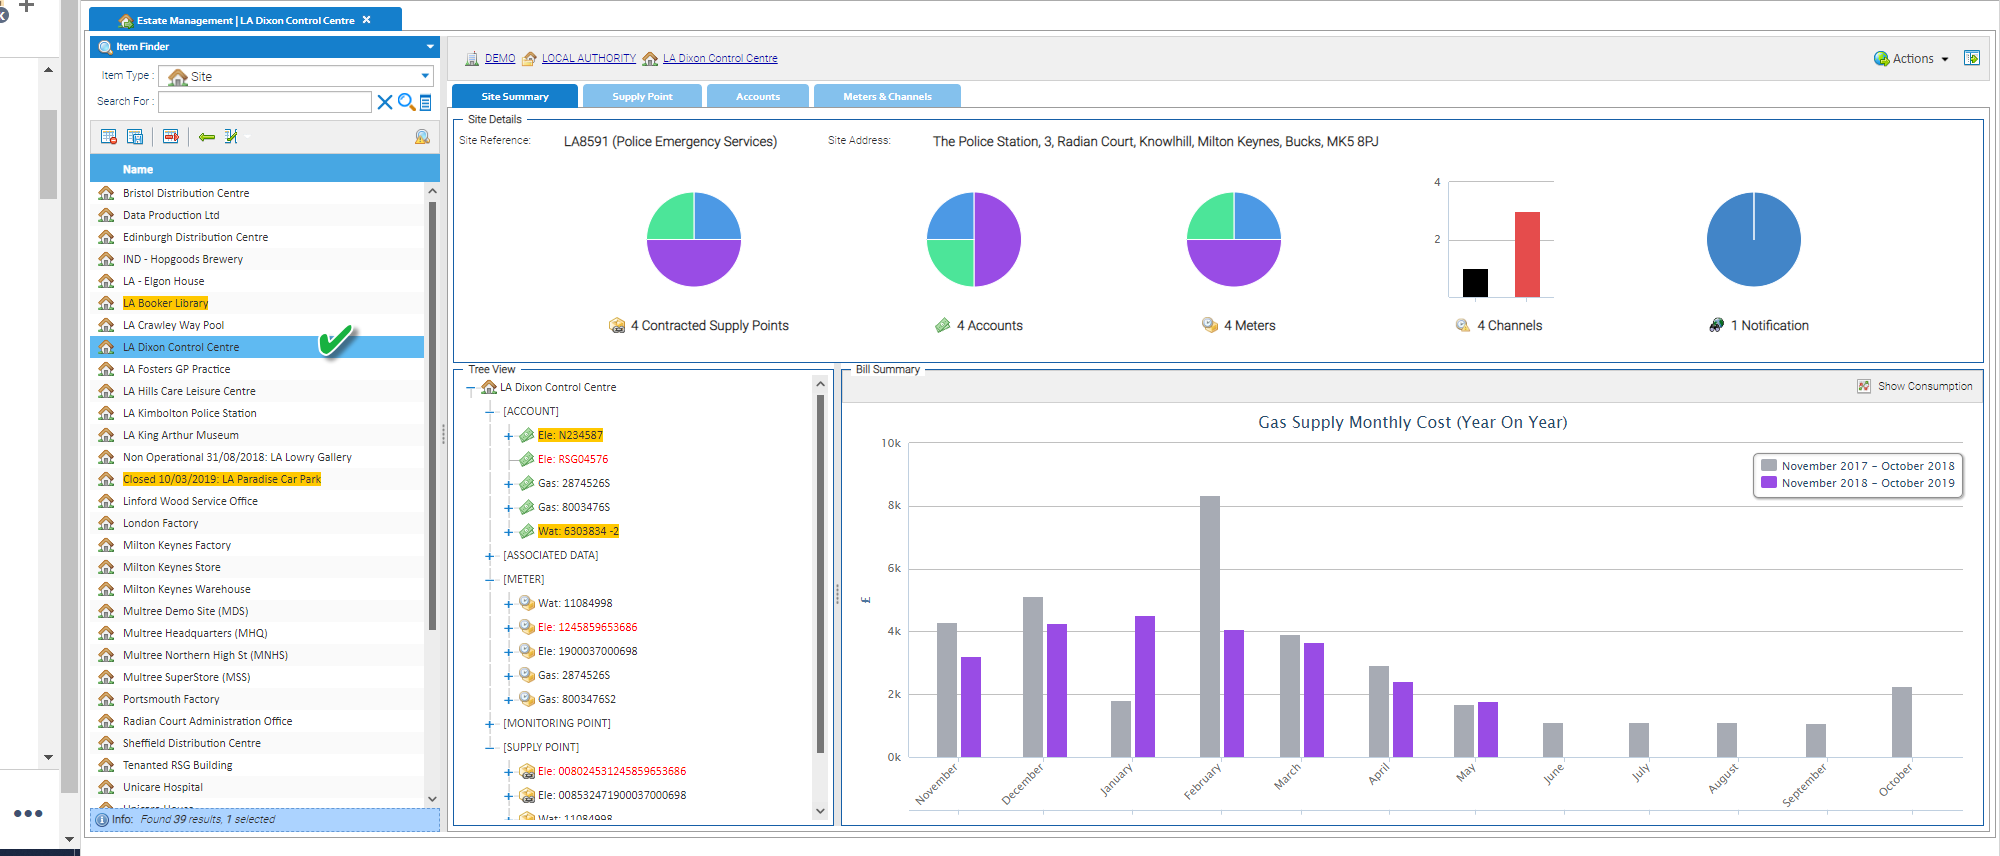
Site Details Section

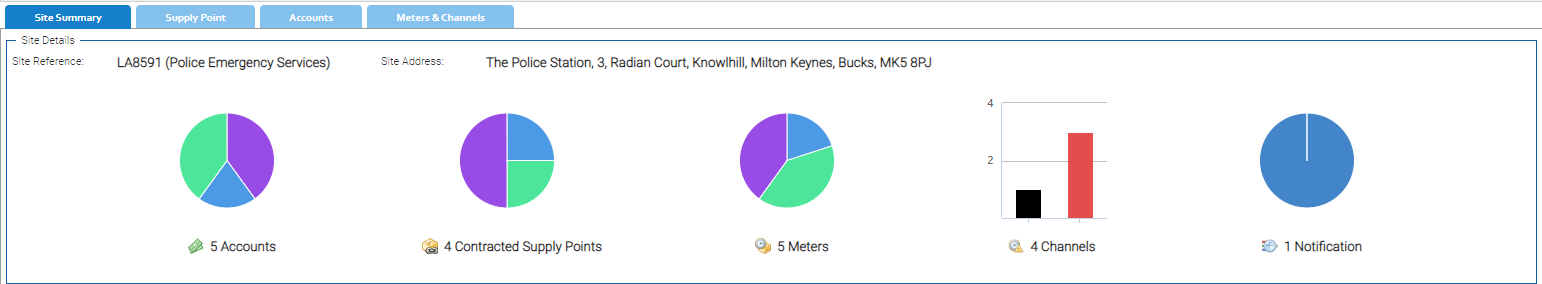
This details :
...
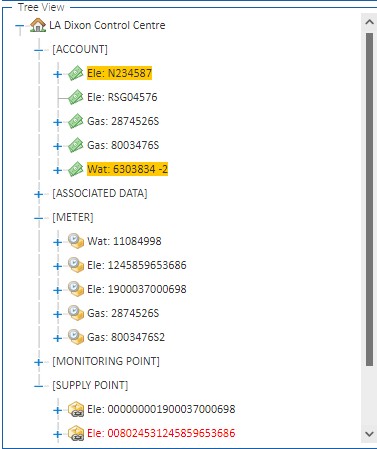
The other Items on the Site will be visible, but will not be expanded by default.
| Tip |
|---|
|
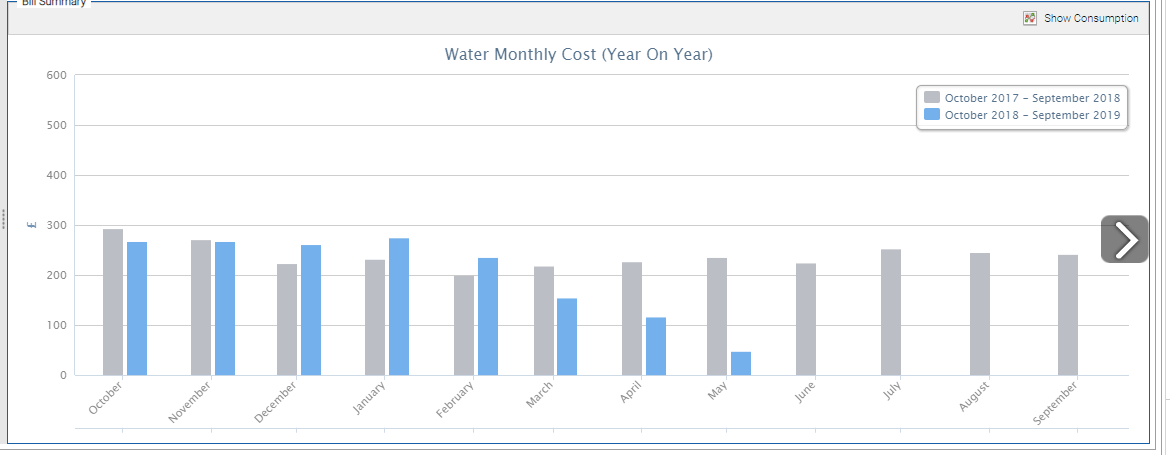
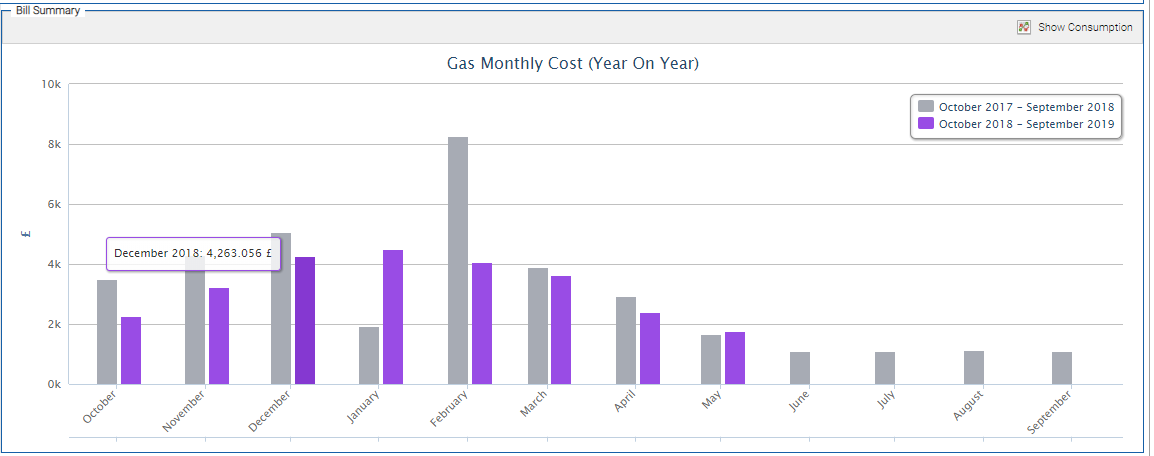
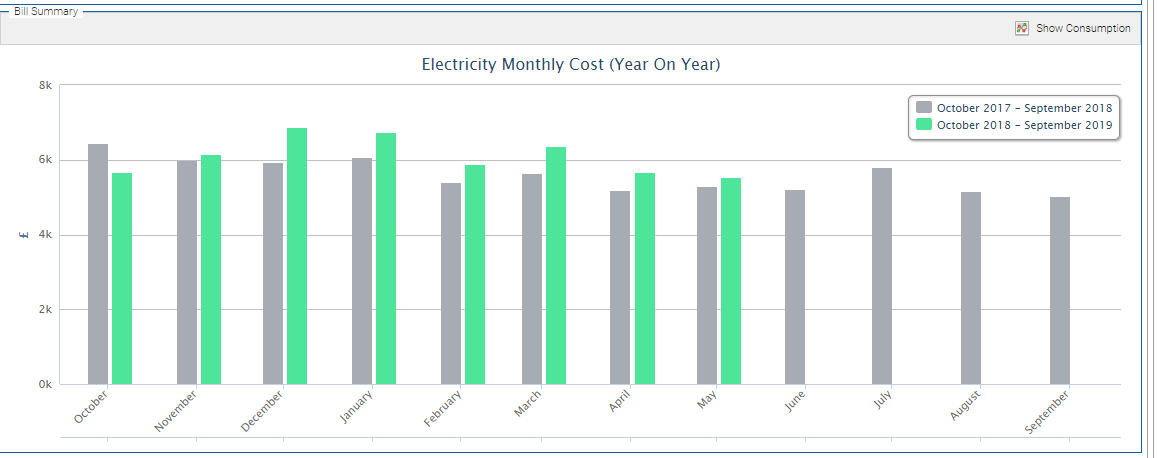
Bill Summary Section
The Bill Summary will default to scroll through the Monthly Cost (Year on Year) for each Commodity, showing the current 12 months versus the previous 12 months. It is aggregating all the billing information (total net costs) for each account on the Site for the applicable commodity.
The coloured bar shows the latest years data for the applicable commodity, the light grey bar shows the equivalent month in the prior year.
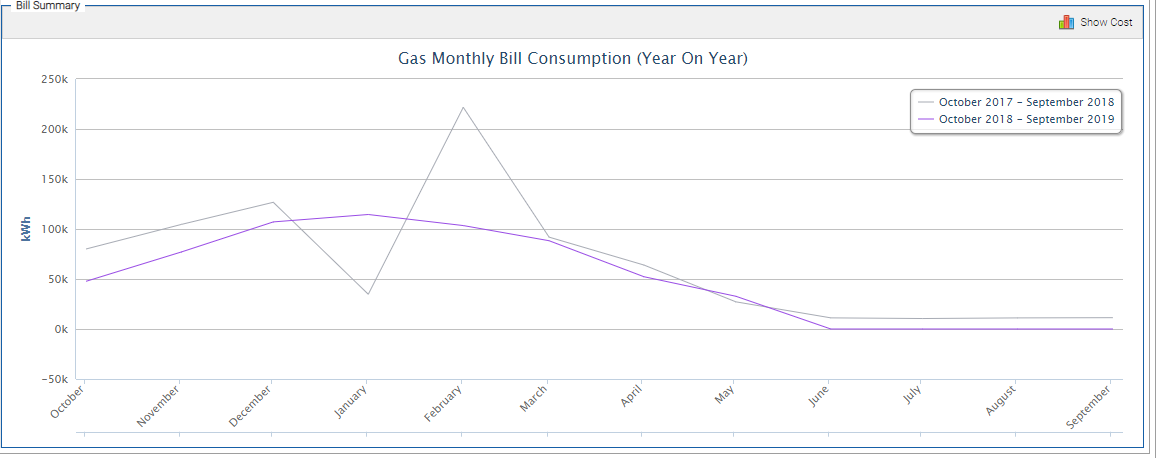
- Click the Show Consumption button to change the graph to show Monthly Consumption (Year on Year) for your Accounts, rather than cost information.
- Click Show Consumption again to change back to Monthly Cost (Year on Year).
Cost Example (Bar)
Consumption Example (Line)
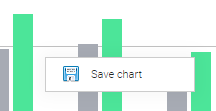
| Tip |
|---|
To manually scroll through each of the Commodities for which Bills exist, hover over the right hand side of the chart and an arrow will appear:
|