...
- every Monday for the past four weeks has used an average of 100 kWh, but the latest Monday has used 150 kWh.
- the weekly consumption for the previous 2 weeks has been 12,000 kWh, but last week was 15,000 kWh
Adding a Dynamic Profile Strategy
...
Dynamic Profile Configuration
The Monitoring Strategy Editor also contains an Dynamic Profile Configuration section that allows you to set the specific configuration to use when finding and managing your data.
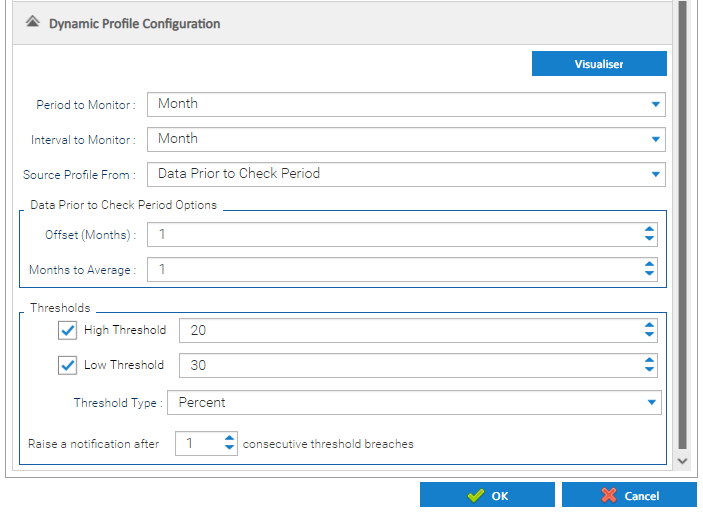
The settings entered here will control how recent data is compared with previous data to determine whether there is an issue. Ultimately, these options provide you with the tools to choose the granularity you want the check to be performed (e.g. aggregated week / day / hour aggregation or half-hourly) and what the system should use as historical data to compare that against.
Whilst each of the fields are explained below in more detail, please click here to jump to a table that provides a some example configurations and (e.g. I want to check a days behaviour with the behaviour on the same days over the last 2 weeks).
...
This represents the period of time you want to compare to. Combined with the offset that can be defined, this will determine what the latest data will be compared to.
Choose from:
- Year (i.e. compare to previous year)
- Month (i.e. compare to same period last month)
- Week (i.e. compare to same period last week
- Day (i.e. compare to same period yesterday)
| Note |
|---|
Please note, the period to Monitor selected will drive at what point in time the system will perform the checks and how it determines the latest period of time that is being checked.
|
Click here to look at example configurations
...
This represents the interval within that period that you wish to monitor. The options available in the dropdown will depend on the Period to Monitor that has been chosen.
Period: Year
- Year
Period: Month
- Month
Period: Week
- Week
- Day
- Hour
- Half Hour
- 15 Minutes
Period: Day
- Day
- Hour
- Half Hour
- 15 Minutes
Click here to look at example configurations
...
Choose from:
- Data Prior to Check Period - this will compare recent data against the period of time directly prior to the period being checked.
- Data Ending on A Fixed Date - this will compare recent data against the period of time directly prior to the end date that has been specified.
...
Data Prior to Check Period is chosen...
compare recent data against the period of time directly prior to the period being checked.
...
Specifying a number greater than one here specifies an offset as to how many prior periods should be skipped when determining the period of time to compare the recent behaviour against.
By default this would be "1" and this means:
- Year - compares against equivalent interval in year directly prior
- Month - compares against equivalent interval in month directly prior
- Week - compares against equivalent interval in week directly prior
- Day - compares against equivalent interval on day directly prior
Some examples where the offset may be changed to something other than "1":
- if a Period of Monthly, if the offset is one, it would compare the last month of data with the month directly prior. However, if you want to compare a month with the same month in the previous year, an offset of 12 could be specified.
- if a Period of Daily is used, if the offset is one, it would compare the last day of data with the day directly prior. However, if you want to compare a day with the same day in the previous week, an offset of 7 could be specified.
...
This will define the number of prior periods of time that will be used to derive an average profile which the recent data can then be compared to to determine if it is suspect or not.
For example if the period selected is:
- Daily - it will source the data for equivalent intervals for the previous x days and calculate an average
- Weekly - it will source the data for equivalent intervals for the previous x weeks and calculate an average
...
Data Ending on a Fixed Date is chosen...
compare recent data against the period of time directly prior to the end date that has been specified.
...
Amend the Fixed date using the arrows or the calendar
...
Use the tickbox to the left of the High Threshold label to enable/disable the high threshold check.
The value entered here is effectively the sensitivity of the upper limit that is permitted when the recent data is compared against the historical data (i.e. where the data spikes). This should be considered in conjunction with the type of threshold listed below.
...
Use the tickbox to the left of the Low Threshold label to enable/disable the low threshold check.
The value entered here is effectively the sensitivity of the lower limit that is permitted when the recent data is compared against the historical data (i.e. where the data drops). This should be considered in conjunction with the type of threshold listed below.
...
Choose from:
- Percent - this is to say that the exception should be raised if the recent data exceeds the permitted tolerance by a specified percentage
- Units - this is to say that the exception should be raised if the recent data exceeds the permitted tolerance by a specified number of units (e.g. 10 kWh or 5m3)
- Standard Deviations - this is to say that the exception should be raised if the recent data exceeds the permitted tolerance by a number of standard deviations from the mean
...
This setting allows you to control how sensitive the check is and whether it should only alert you if the issue is a consistent problem.
For example, you maybe performing a daily check against the same day last week. You might only want it to tell you if a problem is found 2 days in a row, in this case this would be set to "2".
Click OK to save the Monitoring Strategy.
| Info |
|---|
Once the Strategy has been set up, Sigma will review the data each night and create any relevant notifications in the Notifications tab |
...
The table below provides a summary of the different configuration options are available to help clarify how the system can be setup to perform the various checks for you, and what they actually mean.
...
Year
...
Year
...
Change the <period to average> to compare the latest year against the average of the preceding <x> years.
...
Month
...
Month
...
Week
...
Week
...
Week
...
Day
...
Day
...
Day
...
Dynamic Profile Notifications
...