Introduction
The Period Summary Overview provides a table of data for selected Sites detailing summary totals for a selected Period.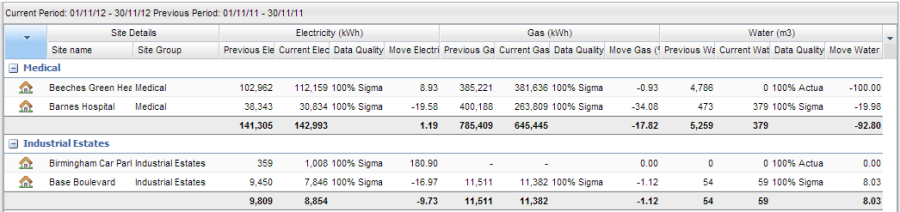
Opening the Period Summary Overview
Click on Period Summary Overview
The information within this activity is gathered from existing Supply Points within the Sigma database.
...
Using the above data sources, it will look to utilise Actual data where possible. For more information on this please refer to the 'Estimation Techniques' help document.
Configuration Settings
Select
Highlight your selected Sites and the screen will show
Tip: If you want to see all Sites, click on one Site in the Data Selector, then Control and A to highlight them all
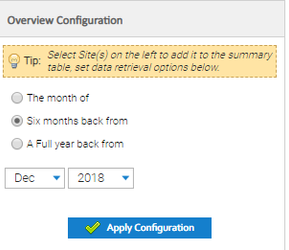
Overview Configuration
To refresh the data showing on screen, select the Sites from the Data Selector then amend the Overview Configuration.
Choose either 'Month', 'from:
The month of
Six months back ' or 'from
A Full year back ' and then specify the Date required.from
Enter the Month
Click Apply Configuration.
...
Column Options
After making your selection your Sites will appear in the table grouped by Site Group.
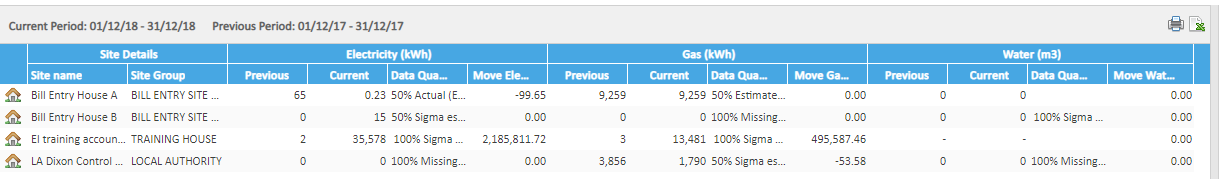
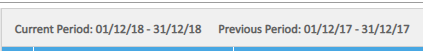
The current period that you have defined within the settings is displayed at the top of the table along with the previous comparison period.
![]()
The table contains two header rows. The first row displays the site information, commodity, CO2 and total consumption/cost breakdown.
Adding / Removing Columns
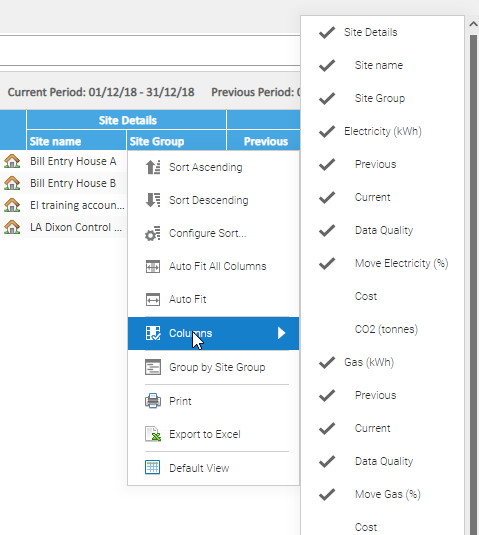
You can amend what columns are available by right-clicking and selecting from the menu.
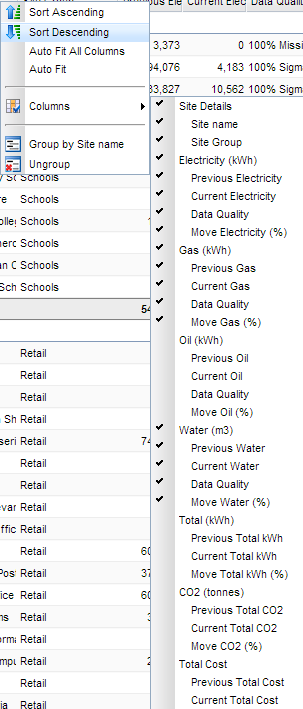
The second row breaks this down even further and again columns can be amended from the right-click menu.
Clicking on any of the column headers will sort the table using that column.
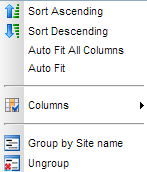
Within the right-click menu on the second row you also have a few other options available.
Clicking on any of the column headers will sort the column.show in the table.
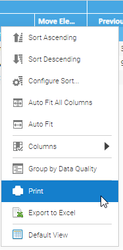
Click on the downward arrow on the column header and choose Columns
Tick / Untick as required
Grouping
To group the view by Site Group, click on the downward arrow on the column header and choose Group by Site Group
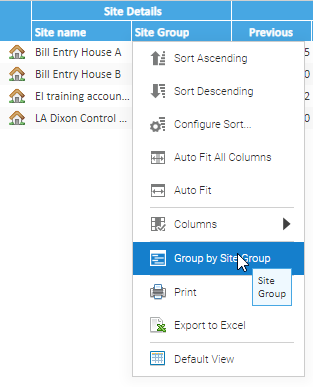
Table Overview
After making your selection your Sites will appear in the table.
The table contains two header rows. The first row displays the site information, commodity, CO2 and total consumption/cost breakdown.
The second row breaks this down even further.
Click on any column headers to sort the column
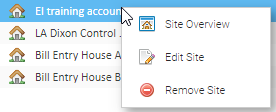
Selecting any of the rows within the table and right-clicking gives you a menu with three options.
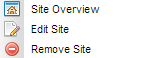
Site Overview – navigates you to the Site Overview activity.
Edit Site – will take you to the Site Editor window.
Remove Site – removes the site from the table.
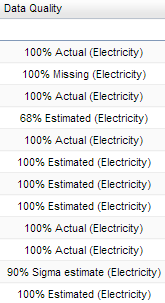
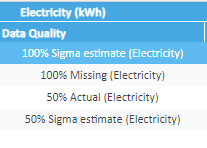
The Data Quality column within the table will detail the quality of the data pulled into the table.
Exporting / Printing the Table
Exporting
There are two ways to export the Table to Excel:
Click on 
OR
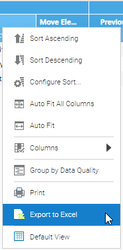
Click on the downward arrow on the Column Header and choose Export to Excel
Printing
There are two ways to export the Table to Excel:
Click on 
OR
Click on the downward arrow on the Column Header and choose Print