...
...
...
...
...
...
...
...
...
...
...
...
...
...
...
...
...
...
...
...
...
...
...
...
...
...
...
...
...
...
...
...
...
...
...
...
...
...
...
...
...
...
...
...
...
...
...
...
...
...
...
...
...
...
...
...
...
...
...
...
...
...
...
...
...
...
...
...
...
...
...
...
...
...
...
...
...
...
...
...
...
...
...
...
...
...
...
...
...
...
...
...
...
...
...
...
...
...
...
...
...
...
...
...
...
...
...
...
...
...
...
...
...
...
...
...
Introduction
The Dashboard is the main focal point when you log into your Sigma Browser Interface. It can be configured by the user to display the most important information by adding various Widgets.
Opening the Dashboard Activity
Click on the Dashboard Activity

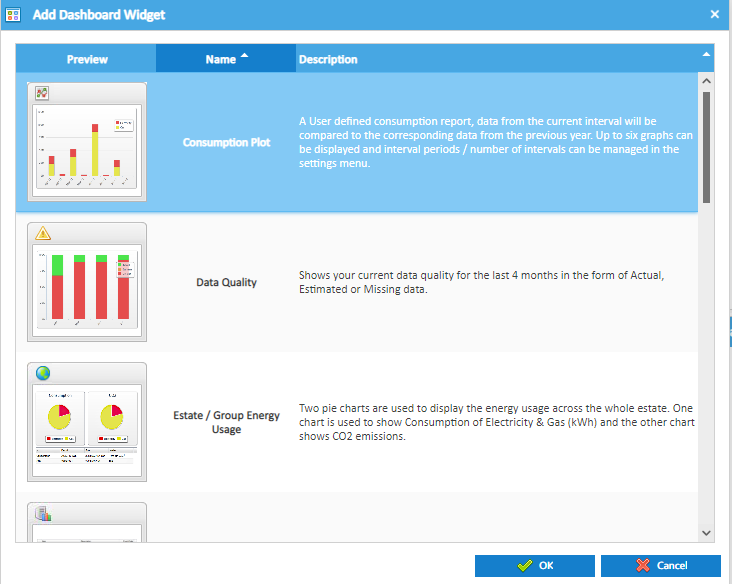
Adding a Widget
Click  to add a widget to the Dashboard
- This will bring up a window with a list of all the available widgets and their descriptions. Select the widget required and click OK
- If the widget has any settings that can be changed, then use the
 icon and adjust it for your requirements
Laying out your Dashboard
The dashboard is split into three columns
When a new widget is added it will go to the column with the least widgets
Widgets can be drag and dropped into a different column or row
Example Widgets
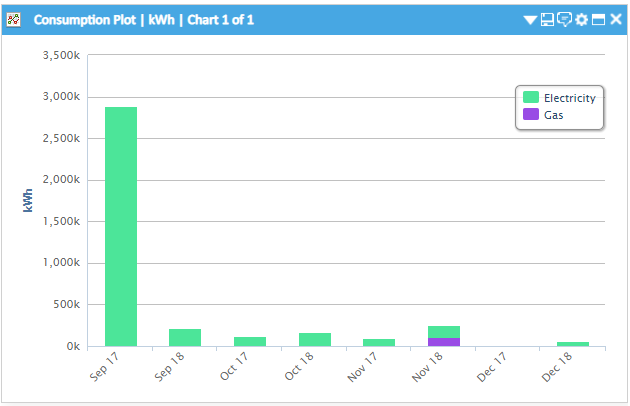
Consumption Plot Widget
This widget scrolls through each specified commodity for the interval and period chosen by the user and displays data in a bar chart
Supply Points are used as the data source, taking data in the hierarchical order of Periodic Channels, Non Periodic Channels and then Accounts
Selecting the settings ![]() icon on the Consumption widget will give you the following options:
icon on the Consumption widget will give you the following options:
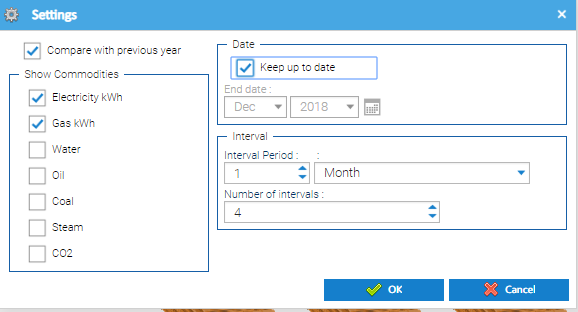
Selecting Compare with previous year this will give you a twin bar on the chart, one displaying the current year, the other displaying the previous year's selection.
For each item under Show Commodities that is selected a new chart will be displayed with the exception of electricity and gas. If both electricity and gas are selected they will be displayed stacked on a single chart.
If there are multiple charts to be displayed the widget will cycle through them every 15 seconds. Alternatively, you can move between the charts by clicking on the arrows that are displayed either side when you hover over the widget.
Selecting Keep up to date the consumption will be worked back from the current date. If this option is not selected then you can enter and end date for the period you wish to be displayed.
An interval period can be selected for the charts and these can be displayed in Days, Weeks, Months or Years. The maximum number of periods available is 13.
Selecting the ![]() icon allows you to navigate to the Performance Overview activity.
icon allows you to navigate to the Performance Overview activity.
This widget will recalculate the data every 24 hours, however whilst it is recalculating you will see the cached image and an icon such as ![]() visible in the top left corner.
visible in the top left corner.
Data Quality Widget
This widget shows the quality of your data for the last four months in the form of actual, estimate and missing data.
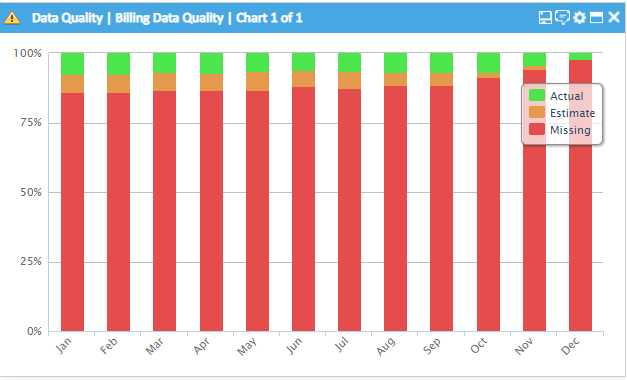
It will show the quality of Billing and HH data separately where applicable.
The data source is only Periodic Channels and Accounts that are setup within Supply Points.
Estate / Group Energy Usage Widget
This widget shows a pie chart for energy consumption kWh and a pie chart for CO2 for the period of the last year to date.
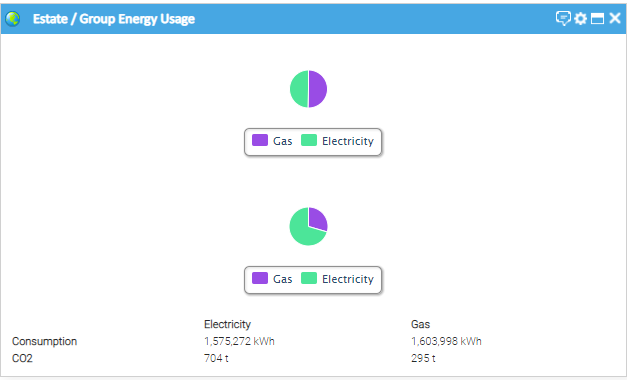
A table of data is displayed below the pie charts with the added water information.
Supply Points are used as the data source, taking data in the hierarchical order of Periodic Channels, Non Periodic Channels and then Accounts.
This widget will recalculate the data every 24 hours, however whilst it is recalculating you will see the cached image and an icon such as ![]() visible in the top left corner.
visible in the top left corner.
Events Widget
This widget shows a maximum 100 of the most recent database events from the entire database grouped by Site.
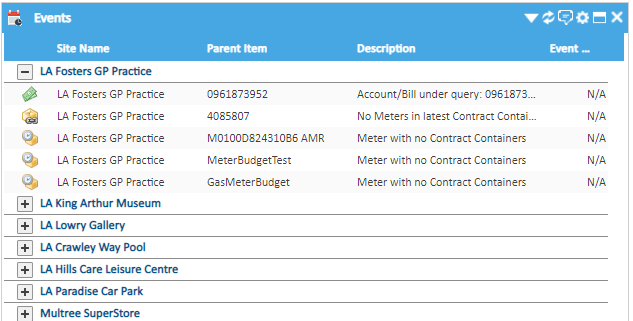
Right clicking on an event gives you the following menu:
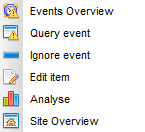
Events Overview – will take you to the Events Overview activity
Query Event – takes you to create a Query
Ignore Event – if you are happy that the event is highlighting something that does not need to be questioned. Use the filter to search for ignored events
Edit Item – opens the editor on which the event is present
Analyse – takes you to the Analysis activity so that you can browse the data for the object
Site Overview – takes you to the Site Overview activity if it is present in your permissions
Selecting the settings ![]() icon on the Events widget will give you the following options:
icon on the Events widget will give you the following options:
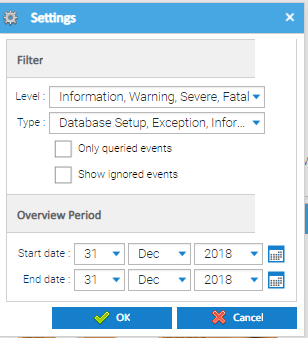
Levels – choose the severity level of the event (e.g. Severe)
Types – choosethe type of event to display (e.g. Exceptions)
Only queried events – select this box to only display events that have an attached query
Show ignored events – select this box to display events that have been ignored
Overview Period - select the date range you want to display (maximum of 2 years)
Processed Bills Widget
This widget shows all of the bills that have been processed for the last four months (both EDI and Manual).
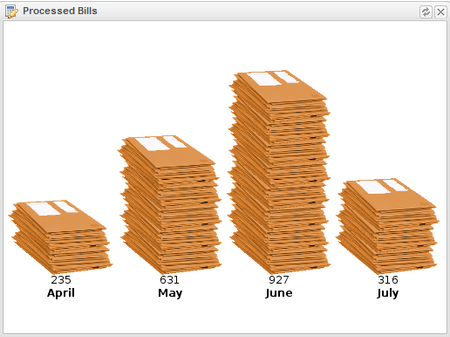
The data source is all the Bills within the database regardless of the status
Widget Options

 - takes you to another Activity, for example Performance Overview
...