Hints & Tips
- Back Button – Don't press the back button! Sigma functions using tabbed windows and pressing the back button will lose your current progress.
...
The Site Overview displays five main sections. These can be viewed for each
...
Site on your database
...
.
Information
Performance
Events
Targets
Site Consumption
Opening the Site Overview
Click on Site Overview
All widgets can be maximised to full screen size.
...
Click to maximise
Click again to minimise
Information
This details the
...
Site name, address, contact, benchmark category, floor area, latest memo, a link to maps, image and current site figures.
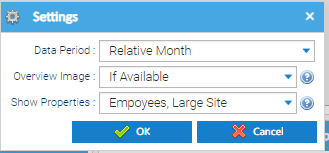
Information Widget Settings
The settings on the widget are as follows:
...
Data Period – relates to the Site figures of Cost, Energy, CO2 and Water. Choose from Relative Month, Last Complete Month or Last Complete Day
Overview Image –
...
Select If Available
...
to show an image of the
...
Site marked with the category of 'Overview'
Show Properties – allows
...
you to specify which
...
Site property keys to display.
...
- Maps – If you enter a postcode (UK) or GPS details for a site, you will be able to view this location from the Map link in the information widget.
Performance
...
Tick/ Untick as required
Click OK to save
Performance
This compares all the Sites in the database which have the same Benchmark Category, showing the current performance against the best and worst
...
Sites.
The data present is based on
...
Supply Points being setup within the database.
Click here for more details on how the information is gathered in Sigma.
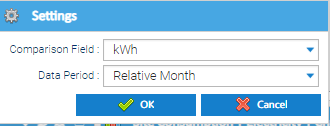
Performance Widget Settings
Selecting the save icon
...
allows you to save the data as an image.
Selecting the settings icon
...
gives you the option to amend
...
the settings
Comparison Field– where you have the ability to choose the type of data you wish to display
...
Data Period – allows you to select the data period you require
...
- Side Panels – When you see the graphic below on a panel it can be collapsed using a mouse click. You can re-open the panel by clicking on the same graphic.
- Section Stacks – Where you see the arrow icon on sections you can click to collapse / expand the section.
Events
...
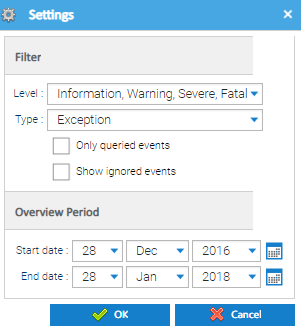
Click OK to save the changes
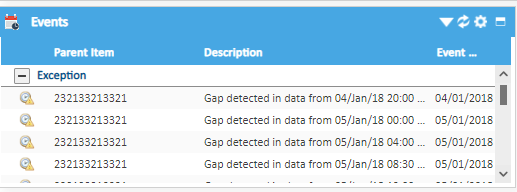
Events
The Events shows the 100 most recent events for the selected Site.
Widget Options
- takes you to the Events Activity
- refreshes the widget
- takes you to the settings to allow you to change the type of events and time period available
...
Targets
...
Amend the Settings as required
Click OK to save
- shows the widget full screen
Targets
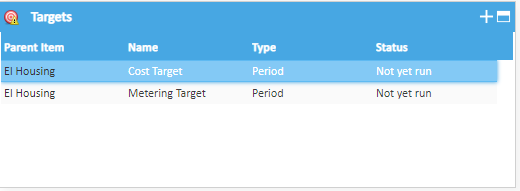
Any targets setup for the site are listed here, incuding those set up for Sites, Meters and/or Accounts
Targets can be period based, CUSUM, etc.
...
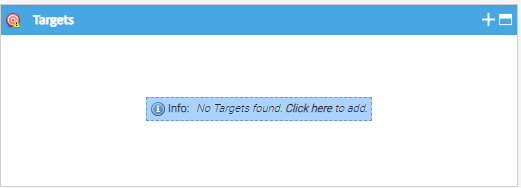
If no Targets exists, the following prompt will show
Either click on 'Click here' or to add a Target.
Alternatively see help files /wiki/spaces/SOUM/pages/14025738 and /wiki/spaces/SOUM/pages/61833533
Once created, you will see the targets in the Targets Widget
If a target is not met then an event will be created and show in the Events Widget. Monitoring Point
A Monitoring Point stores information that has been created from various sources of data. For example, a calculation of the total gas consumed by a number of sites derived from gas consumption data at each individual site.
The data in the Monitoring Point object would be generated by an equation (in this case a simple sum) combining all of the sources of data (in this example gas consumption at each site).Consumption Graphs
- Consumption Graphs display an area graph of data for each selected Site.
- Any settings applied to this widget are applied across the whole database.
...
- Selecting the start month in which the data is displayed on the graph.
- You can then select the length of period by clicking into the table and changing the number.
...
- Tree Selector – Shows database objects arranged in the form of a tree (that can be expanded or collapsed).
- Multi List Selector – Shows database objects in the form of lists or data columns.
- Item Finder – Perform a search on specific database objects.
- Global Search – Perform a search on the whole database.
- Stored Searches – Access any searches you have previously saved.Navigation
- Selecting Actions in the top right of the screen will allow you to navigate to other activities within Sigma including Regression.
...
Site Consumption
The settings icon allows you to change the start date for the consumption and allows you to choose which commodities to display.
Click
Amend as required
Click OK to save
If you have more than one commodity the Widget will scroll between them (note the top of the Widget shows the commodity and, in this example, Chart 1 of 2)
Navigation
Select at the top right of the screen allows you to navigate to other Activities within Sigma.
No Data available error
If no data is available for a Widget, you can click the blue window to modify settings or add data.


