This page gives a brief outline of what each Activity in Sigma is for, and an image of each Activity.
...
| Table of Contents | ||
|---|---|---|
|
Admin and Maintenance
| Activity Name and Description | Image |
|---|---|
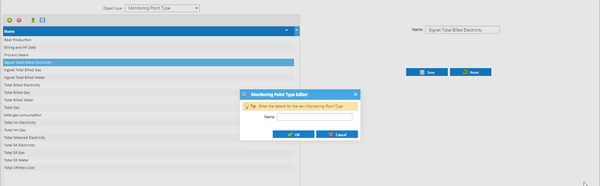
Database Object Setup
Allows you to add to dropdown lists such as Associated Data Types, Meter Types, Property Keys, Monitoring Points etc |
|
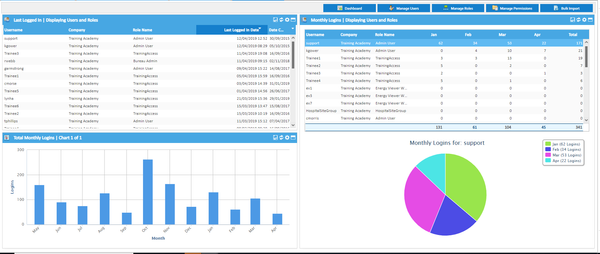
User Admin
Allows you to set up Users (people) and Roles (access rights) for your database. Users can be set up with permissions that only allow them access to certain Sites and certain Activities. A Dashboard displays details of User information such as last logged in dates, monthly logins and total monthly logins can be seen from the Widgets. |
|


General Activities
| Activity Name and Description | Image |
|---|---|
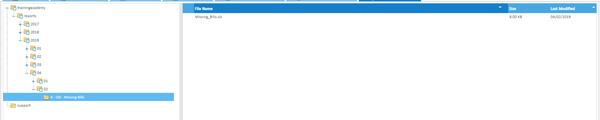
Document Library
This is where documents are saved to when you choose the option in the Reporting Activity. It will also store EDI Files. They are displayed in date ordered folders. |
|
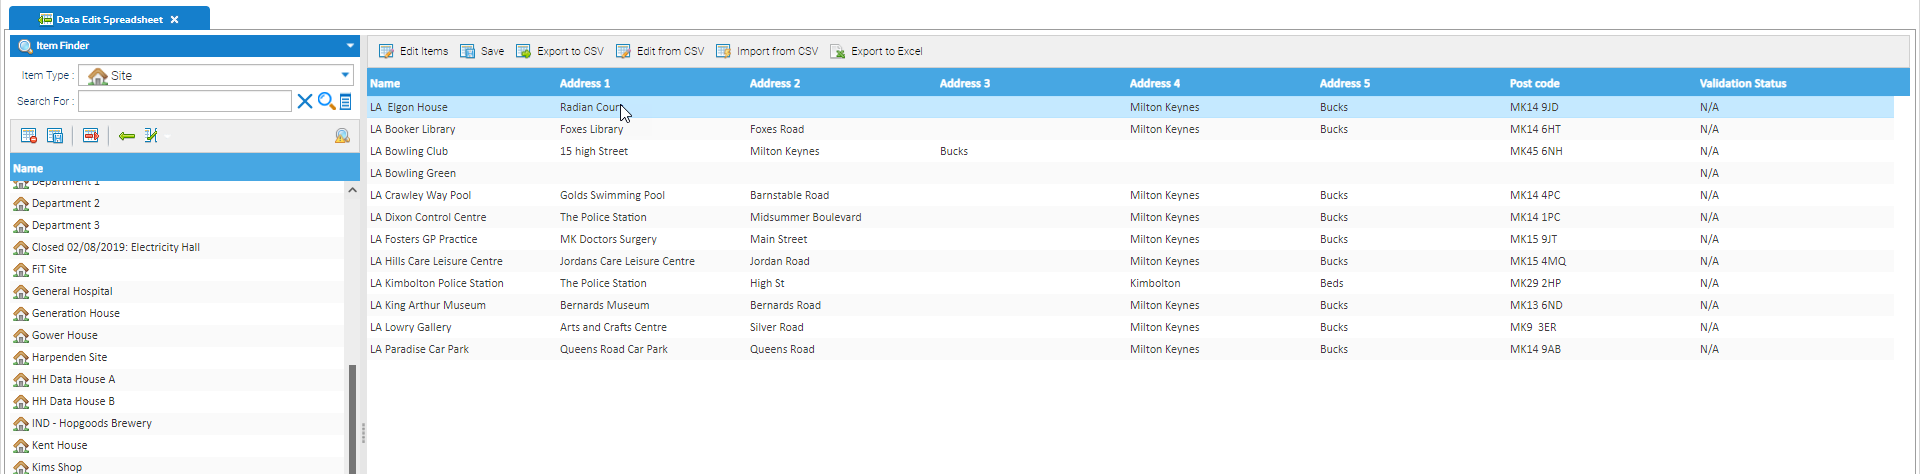
Data Edit Spreadsheet
This Activity allows you to export data such as Site Names, Addresses etc or Meter details etc. You can also amend details in bulk such as adding Post Codes, Property Keys, amending Data Load IDs etc |
|
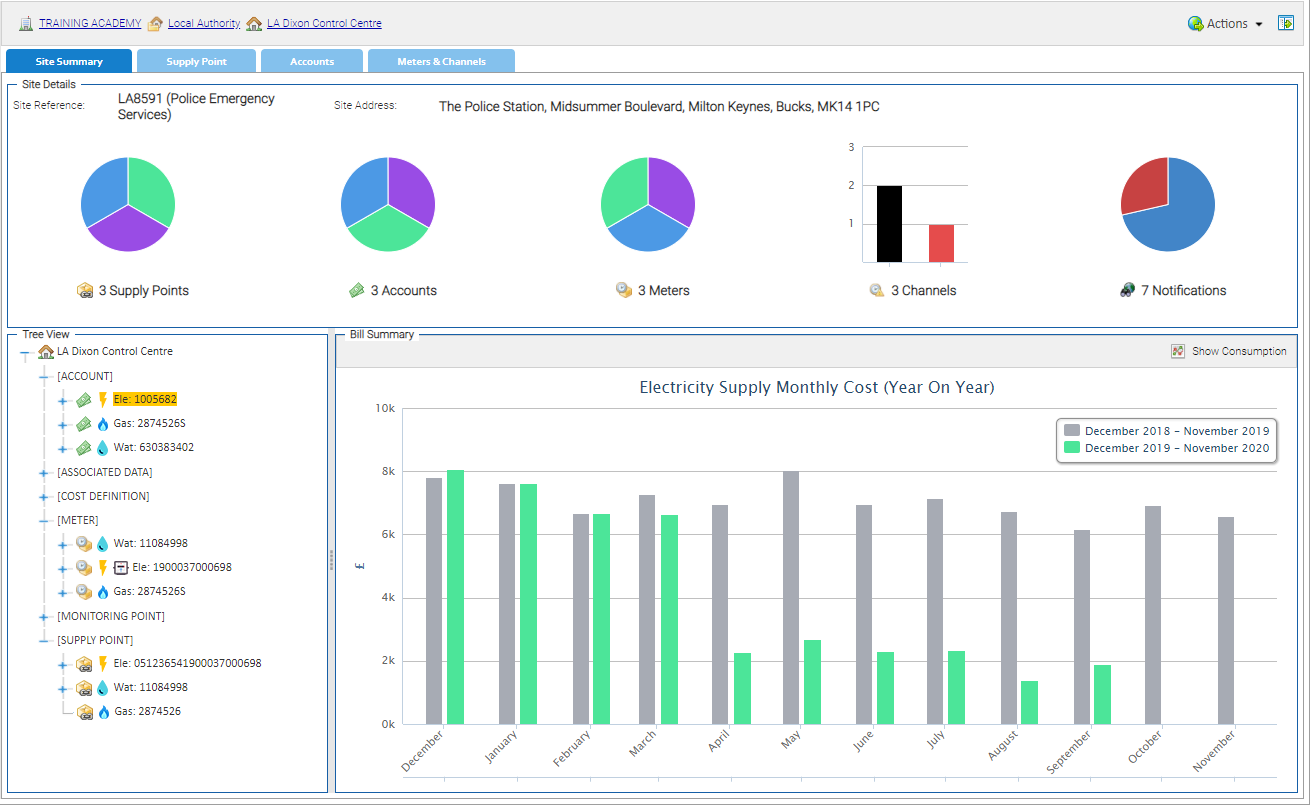
Estate Management
This Activity shows all of the data connected to a Site, for example the Supply Point, Meters (and Channels), Accounts, Contracts etc and allows you to manage your key assets for each Site. It has four tabs to display the relevant information and many links to other Activities such as Bill Entry and Reporting. |
|
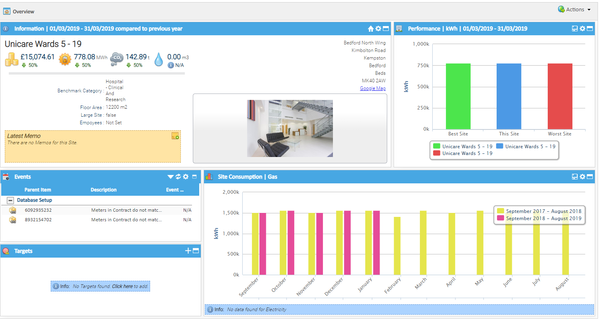
Site Overview
Allows you to view one Site at a time. Each Widget displays information regarding the site and settings can be amended on one. Photos, memos and Property Key details can be added. |
|


...
| Activity Name and Description | Image |
|---|---|
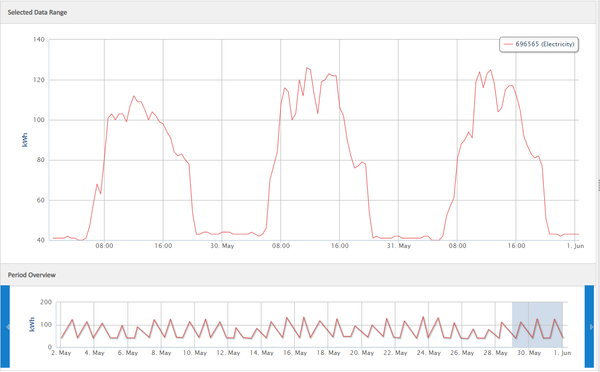
Browsing Data
Allows you to view data such as Half Hourly data, with the ability to compare more than one stream at a time. You can choose a set period or define your own, then zoom into the data to see in more detail. |
|
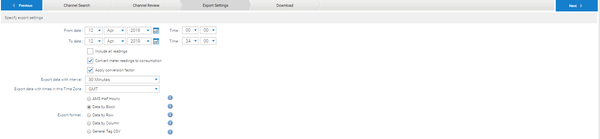
Channel Export
Allows you to export data from channels such as Meter Readings or Half Hourly data (which can be displayed in days instead of half hours). A date range can also be chosen, along with the format of the export. |
|
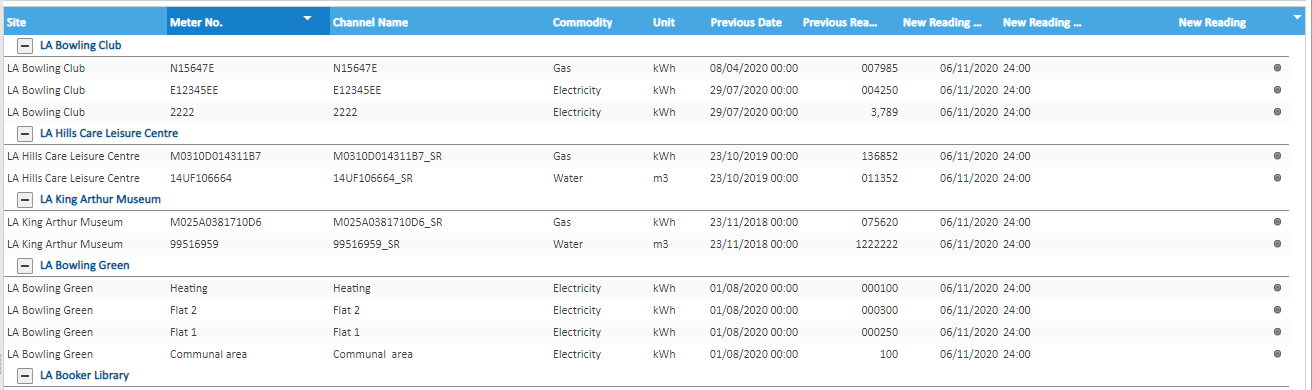
Data Input
Allows you enter meter readings for Non Periodic Channels. The Activity gives details of the Site, Meter, Channel, Commodity and Unit Type. It also shows you the previous Meter Reading and Date, along with fields to allow you to enter the new Meter Reading and Date. Meter Readings can be added for multiple Sites/Meters and then saved. |
|
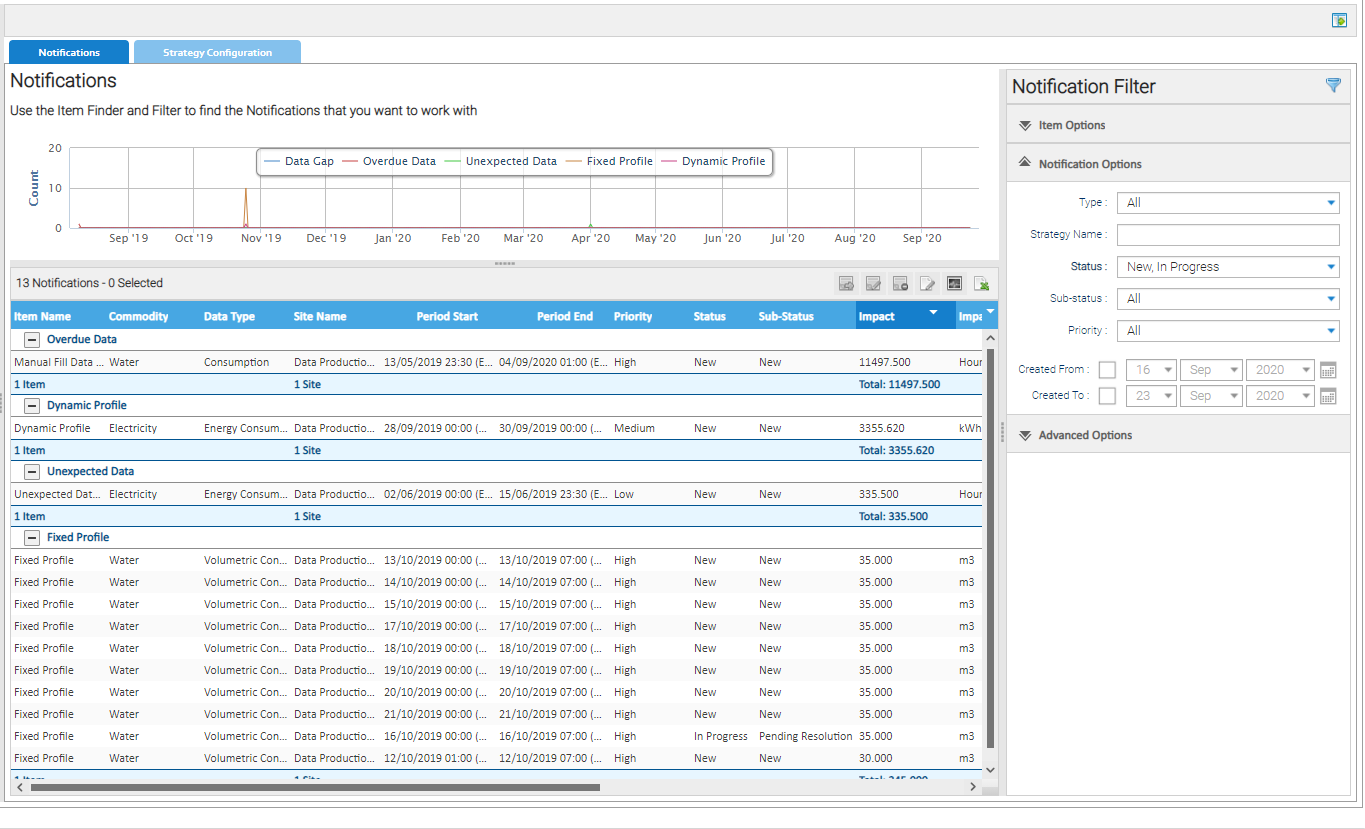
Data Monitoring
This Activity promotes proactive energy management with robust and auditable data - a scheduled task will monitor data related issues in high frequency data (HFD) periodic channels as per your configuration, identifying and recording notifications and automatically closing them where they have been resolved. |
|


Reporting
| Activity Name and Description | Image |
|---|---|
Energy Intelligence
A business intelligence and analytics module that provides Sigma users with the capability to interact Reports can run or copied to enable Users to add/delete criteria. Users can also create their own Reports. All Reports can be set to Broadcast (scheduled) to be delivered at a time suitable to them. |
|
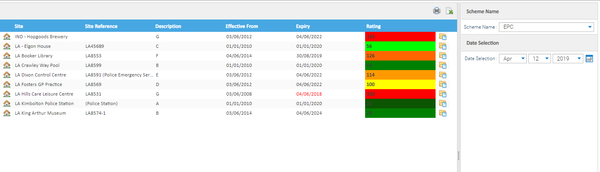
Energy Ratings Overview
Allows you to add details of schemes such as Display Energy Certificates or EPCs. Details such as the expiry date and rating can also be added, enabling you to see at a glance when certificate run out. |
|
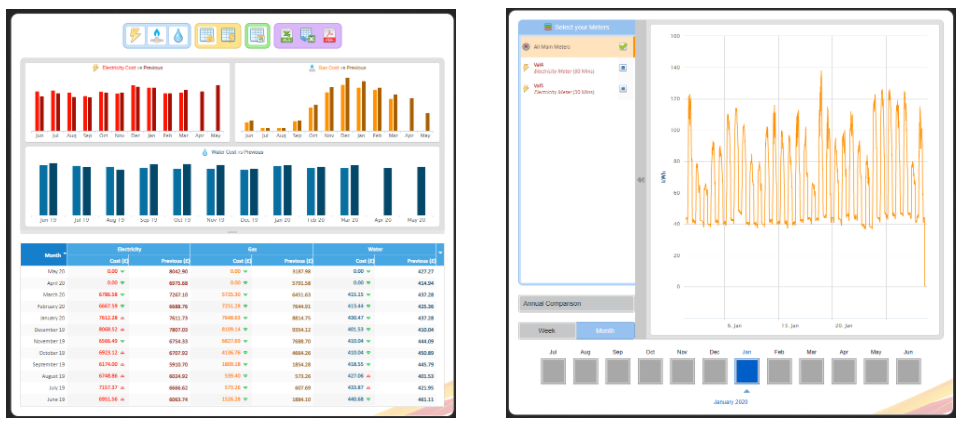
Energy ViewerEnergy Viewer is a separate web address which provides a quick overview of Site energy and billing data. |
|
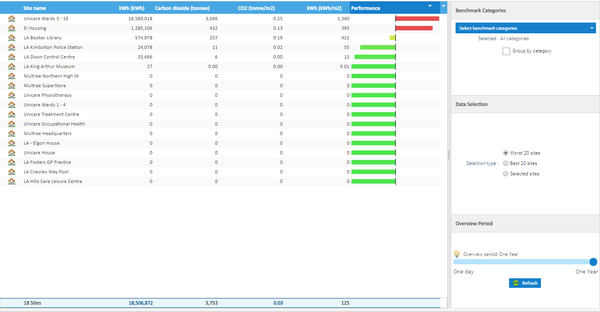
Performance Overview
This provides a table of data for all of the Sites comparing their performance. There are options to show the data grouped by benchmark category, to show best or worst performing sites and to change the overview period between 1 day and 1 year. |
|
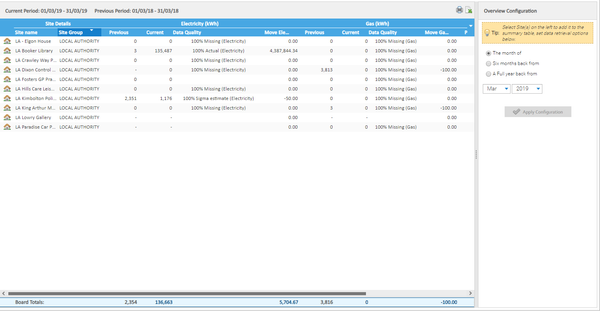
Period Summary Overview
This provides a table of data for selected Sites detailing summary totals for each commodity. Periods can be selected from a month, six months back or a full year back from the current date. |
|
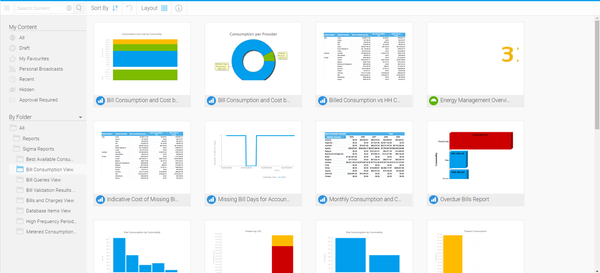
Reporting
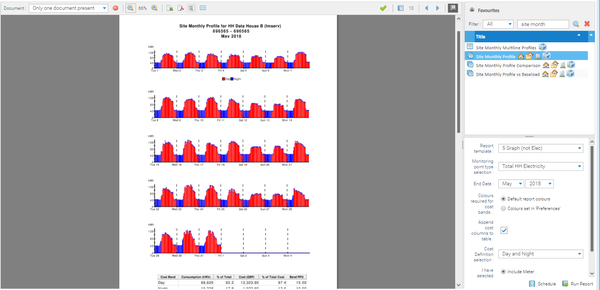
Allows you to Report on Items within Sigma such as Site, Meters and Accounts. Reports are run by choosing the criteria on the left had side (Site, Meter, Account etc) and then the report chosen on the right hand side. Reports can be run to show on screen, can be sent to the Document Library with Sigma or scheduled to run at intervals and times chosen by the User. |
|


...