Sigma Online User Manual
Copying / Editing EI Reports
Any report that has been created can be copied, amended and saved into Energy Intelligence. For instance, you can change the column order, hide and/or rename columns or make amendments to the filtering options.
This allows you to take a report that has most of the criteria you are looking for, but allows you to add/delete columns, change charts (ie from Columns to Lines) or change measurements such as floor area to occupation.
Note, you can not edit a report that has been added by Team, but if you want to make changes, copy the report and make any amendments you want to. Then save the Report in your own Folder.
Copying the Report
- Open Energy Intelligence
- Search for the report using the Search field (top left)
OR
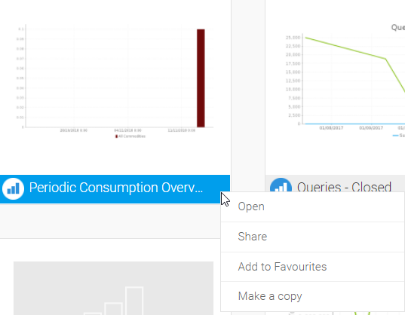
- Scroll down the list / thumbnails
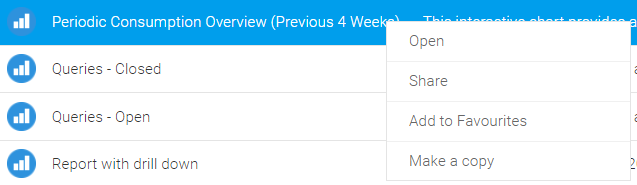
- Click on the dots on the Title
- Click Make a copy
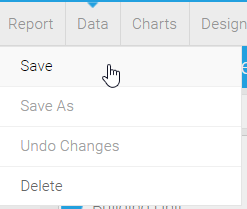
If you have already opened a Report and want to copy it:
- Click Report
- Click Copy
The Report will open and you can start to amend it.
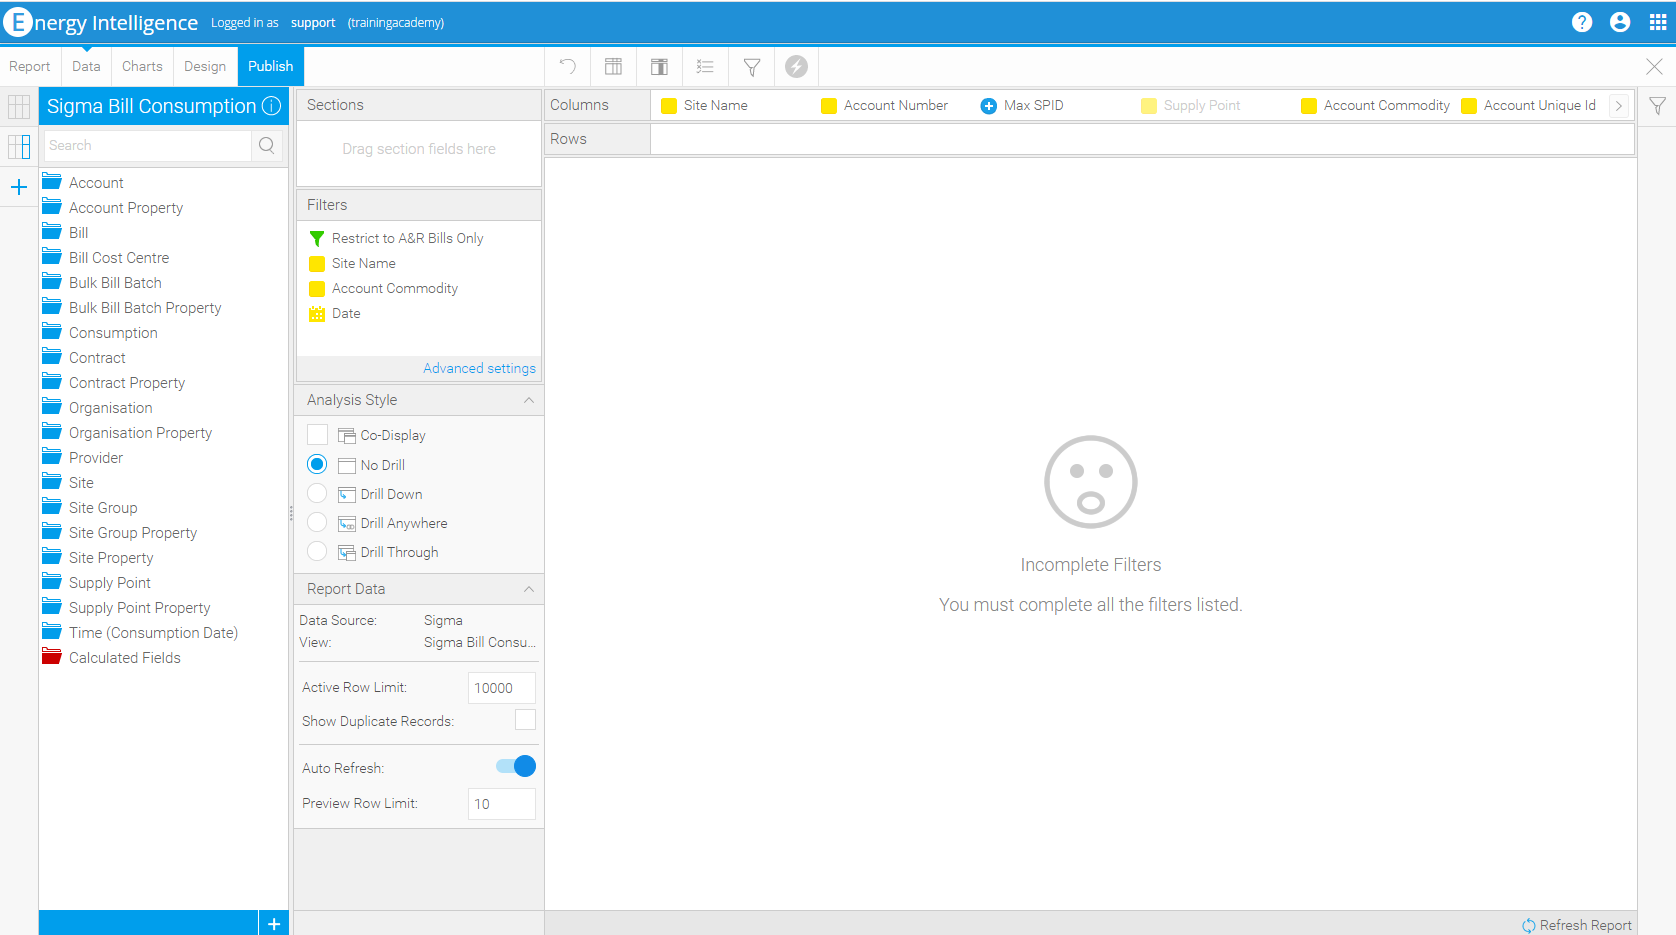
Viewing the User Filters when editing the Report
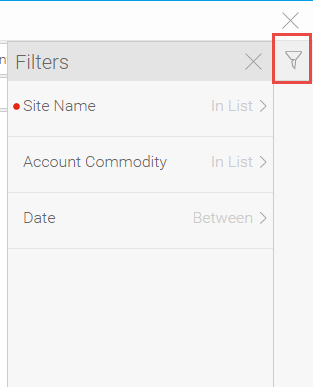
All Filters will show in the Filters Section, but you can see (and use) the User Filters from the right hand side of EI.
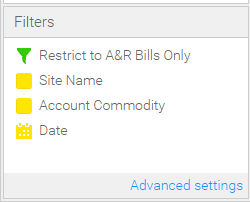
- Click on
 on the right hand side to view which Filters are User Filters (the Filters that a User will see and be able use when they run the Report). Any mandatory Filters will show with a Red Dot.
- Click on each Filter
- Click on the Magnifying Glass to choose from a list
Once you have completed any mandatory Filters and any other optional Filters
- Click

The screen will display the filtered data
Adding / Removing Columns
Additional Columns can be added to the Canvas or Columns and Rows sections.
- Open the Folders on the left hand side to see the Dimensions and Metrix that can be added to a Report
- Drag and Drop a new Metrix or Dimension to Canvas, Columns or Rows
To remove:
- Hold the mouse down on the Metrix or Dimension in the Column or Row and drag out and let go
OR
- click on the downward arrow on the Column Header
- Click on Delete
Adding in Columns to show Differences
Energy Intelligence can show you the difference between two columns. For instance if you have a Master Query of this year's consumption and a Sub Query of last year's consumption, you can add a column to see what the difference is.
- From the Data tab, drag and drop the Cons Day total into the Report (the same field that you have already added)
- Click on the Column Heading for Cons day total
- Click Advanced Function
- Choose Difference of Columns
- Choose the this year column from the Column selection (to show the difference between this year and last year)
- Click Save
- The Column name will be amended to Subtraction of Cons Day Total
- Click Advanced Function
Adding in Columns to show Percentage
Energy Intelligence can show you the difference in percentage between two columns. For instance if you have a Master Query of this year's consumption and a Sub Query of last year's consumption, you can add a column to see what the percentage difference is.
- From the Data tab, drag and drop the Cons Day total into the report (the same field that you have already added) (again)
- Click on the Column Heading for Cons day total
- Click Advanced Function
- Choose Percentage Change Against Columns
- Choose the this year column from the Column selection
- Click X to save
- Click Advanced Function
- The column name will be amended to % Of Cons Day Total
Hiding Columns
If you do not want Columns to show in table, they can be hidden. It may be that you have the Site ID as a column, but do not need to see it in the table.
- Click on the Column Header
- Click Hide Field
Renaming Columns
Columns will automatically be named in Energy Intelligence. Any column can be renamed to your own wording. For instance, the default name might be Bill Daily Net Amount and you want to call it This Year total Bill Amount.
- From the Data tab, click on Column Formatting
- Click on the column name (ie Bill Daily Net Amount)
- Enter the new wording in the Display field (ie This Year total Bill Amount)
- Click down the list of columns to rename others
- Click X to save
- Click on the column name (ie Bill Daily Net Amount)
OR
- From the Data tab, click on the individual column header
- Click Format
- Click Edit
- Enter the name in the Display field
- Click X to save
Adding Prefix or Suffix to Columns
Some columns may be cost specific or commodity specific, so you may want to add a Prefix or Suffix.
- Click on Column Formatting
- Click on the required Column name (ie % Difference)
- Add a Prefix to the Prefix Field (ie £)
- Click on the next required Column name
- Add a Suffix to the Suffix field (ie %)
- Click X to save
- Click on the required Column name (ie % Difference)
Adding Totals to the Columns
Columns can be totalled if they contact costs or consumption figures.
- From the Data tab, click on the Column Header
- Click Totals
- Click Sum
Changing the Column order
Columns can be moved to whatever order is best for you.
- From the Data tab, drag and drop the column to the required place
Changing the Column width
Energy Intelligence will expand a Column if the header is long. You can resize each Column width if required.
- From the Data tab, drag the width of the columns on the Canvas to the required size
Conditional Formatting Columns
When creating a Report, you may have data that needs to be highlighted, such as when the difference between two columns is over / under a certain percentage. To do this, use the Conditional Formatting option.
- From the Data tab, click on Conditional Formatting
- Click on the Column (ie % Difference)
- Style - Choose Cell or Icon
- Cell will highlight the cell in a specified column
- Icon will add an icon in the specified column
- Click + Add Another Rule
- Choose Equal to, Greater than, Between etc -
- Enter the Value ie -50 (-50%)
- Click on the background colour icon
- Choose the colour (green)
- Click Submit
- Add another rule if required
- Click X to save
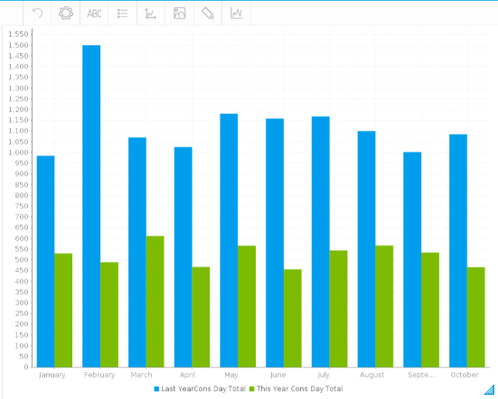
Changing the Chart layout
The default when creating a Chart is to put gaps between all the data. If you prefer data to be side by side (for instance, this year and last years consumption totals), you can amend the layout of the Chart.
Changing the Appearance
- Click on the Chart tab
- Click on Axis
- Click on Horizontal
- Click on Style
- Category Spacing – change to 4
- Series Spacing – change to 0
- Click on Style
- Click on Horizontal
- Click X to Save
- Click on Axis
Changing the Chart order to Monthly
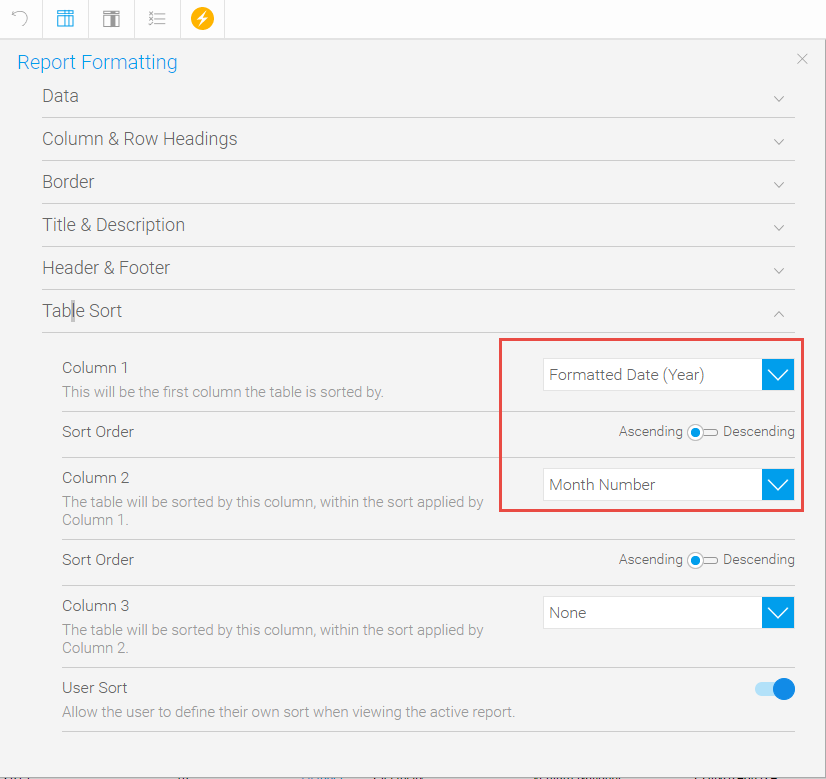
If you are using months in the Chart, EI will generally order the Chart alphabetically. This can be changed using the Table Sort option in the Column Formatting.
If you have added a year and a month column, they need to be sorted as follows:
- Add the following Columns to the table:
- Formatted Date (Year) Column
- Month Number Column
- Month Column
- Click Column Formatting

- Open the Table Sort section
- Choose Formatted Date (Year) for Column 1
- Choose Month Number for Column 2
- Open the Table Sort section
- Click on the X to save the changes
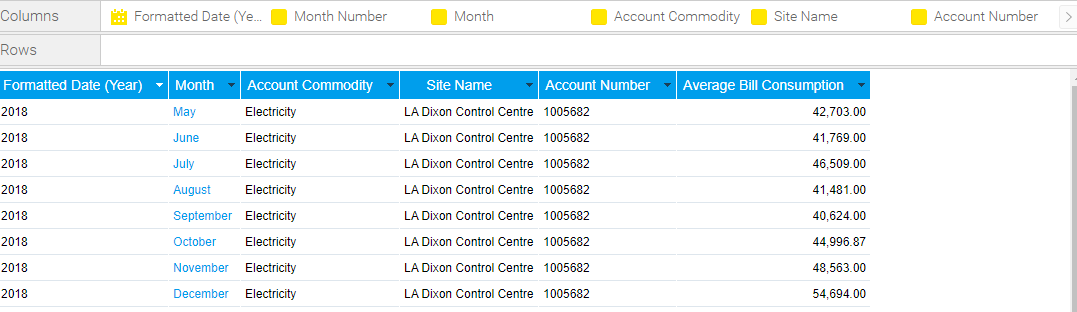
The Columns are now in Month and Year order. If you do not want to see the Month Number in the Columns, they can be hidden:
- Click on the downward arrow on the Column Header
- Click Hide
For the Chart to show in the correct order:
- Click on the Charts Tab
- Click on the Month field
- Click Sort By
- Click Data Order
- Click Sort By
- Click on the Month field
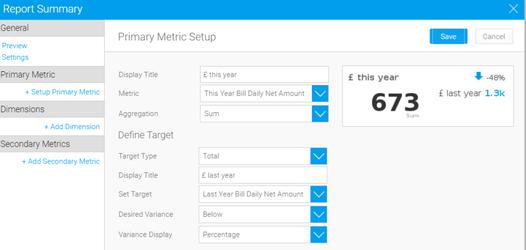
Adding a Summary Box
This example shows how to add a Summary Box to show the total of This Years Bill Daily Net Amount, compared with the same period last year. It also shows the percentage up/down on the same period last year.
- Click on the Design tab
- Click Summary icon (top of screen)
- + Setup Primary Metric
- Display Title – £ this year
- Metric – This Year Bill Daily Net Amount
- Aggregation – Sum
- Target Type – Total
- Display Title - £ last year
- Set Target – Last Year Bill Daily Net Amount
- Desired Variance – Below
- Variance Display – Percentage
- Click Save
- Click Submit
- + Setup Primary Metric
Saving the new version
- Click Report
- Click Save
- Amend the Title
- Amend the Description
- Choose the Folder to save the Report in
- Choose Public or Private
- Click Save
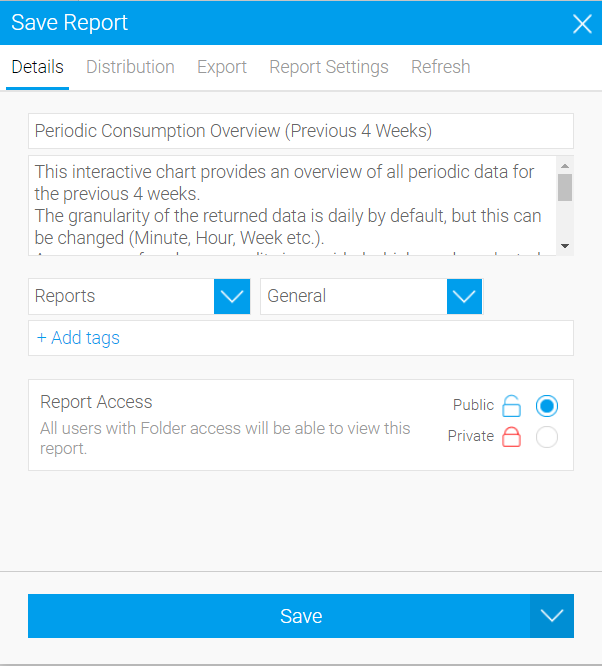
The report is now saved and can be used as and when required.
@ Copyright TEAM - Energy Auditing Agency Limited Registered Number 1916768 Website: www.teamenergy.com Telephone: +44 (0)1908 690018