Sigma Online User Manual
Estate - Best Available Consumption EI Reports
This page shows Reports that use the Estate - Best Available Consumption View. The first column has a link that will open the Report in Energy Intelligence.
Click on the link in the table to take you directly into the Report in Energy Intelligence in your own database.
| Report Link - click on the link to log into Sigma and view the Report | Thumbnail | Report Description |
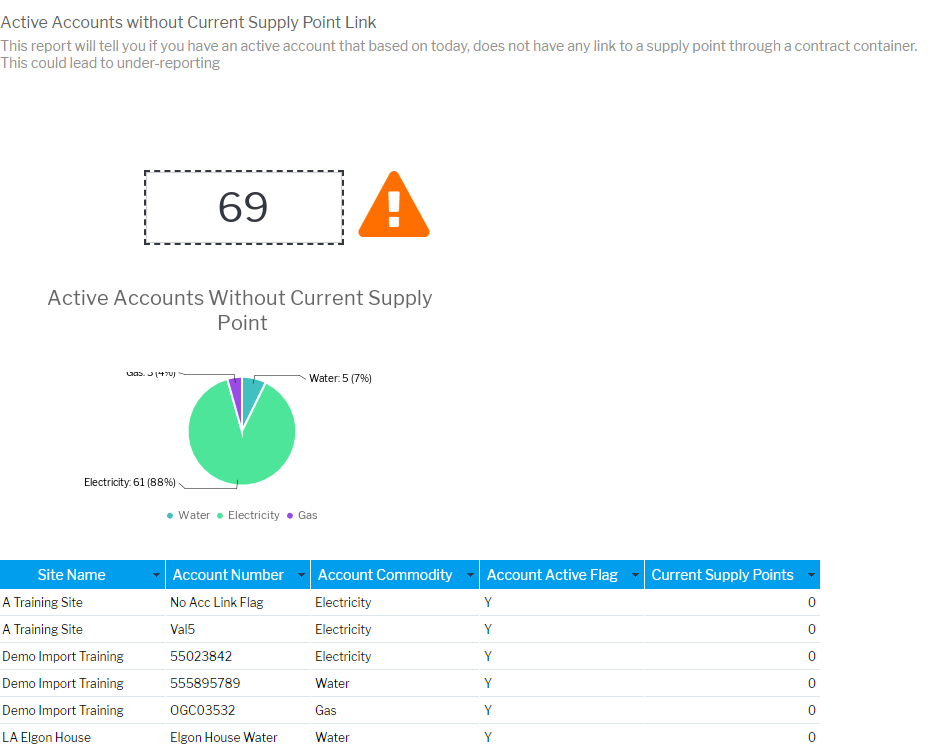
| Active Account without Current Supply Point LinkThis report will tell you if you have an active account that based on today, does not have any link to a supply point through a contract container. This could lead to under-reporting | |
| Carbon Factors by Commodity |
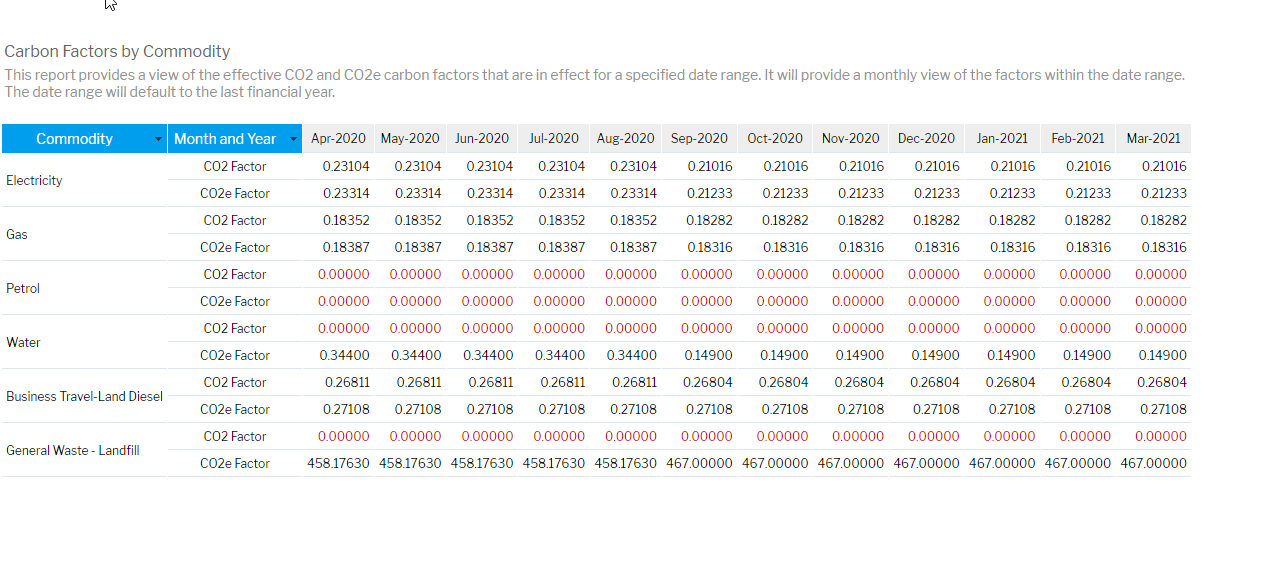
| Carbon Factors by CommodityThis report provides a view of the effective CO2 and CO2e carbon factors that are in effect for a specified date range. It will provide a monthly view of the factors within the date range. The date range will default to the last financial year. A red zero indicates that no factor is available (either standard or custom), a black zero indicates that no data is available, therefore the factor can not be exported. |
CO2 and CO2e Variance Over Time (Best Available Data) |
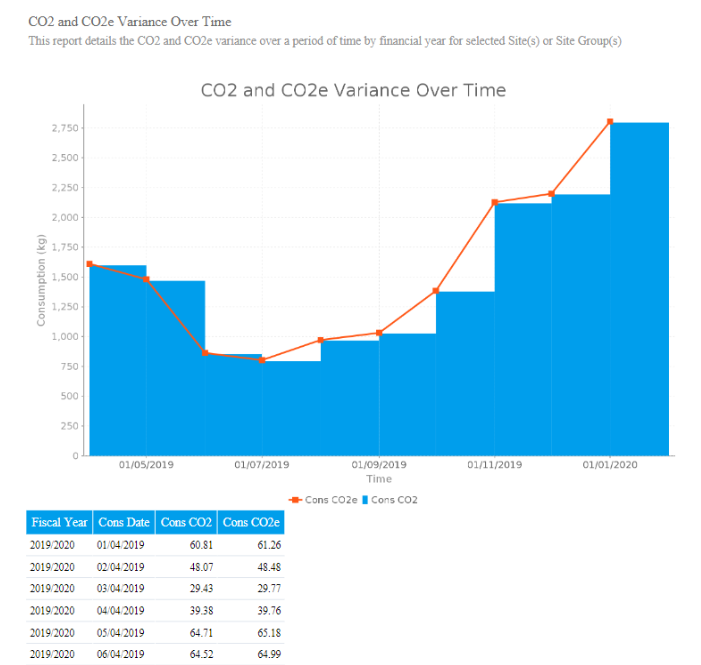
| CO2 and CO2e Variance Over Time (Best Available Data)Details the CO2 and CO2e variance over a period of time by financial year for selected Site(s) or Site Group(s) |
| Cons Data Emissions Summary |
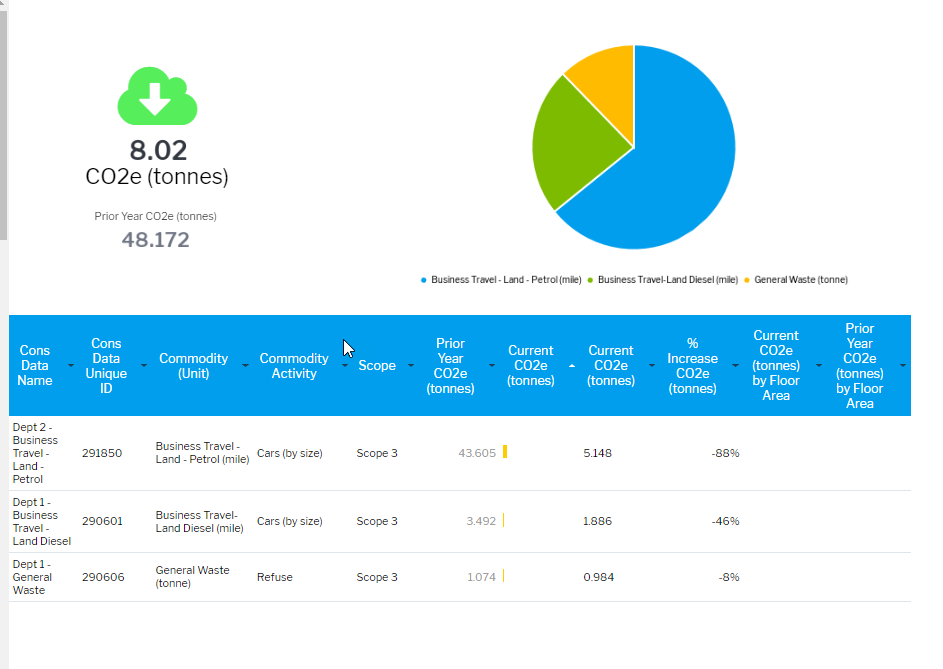
| Cons Data Emissions SummaryThis report provides an overview of CO2e emissions across all Consumption Data Channels (based on selected filters) as well as the quality and completeness of data used to calculate these figures |
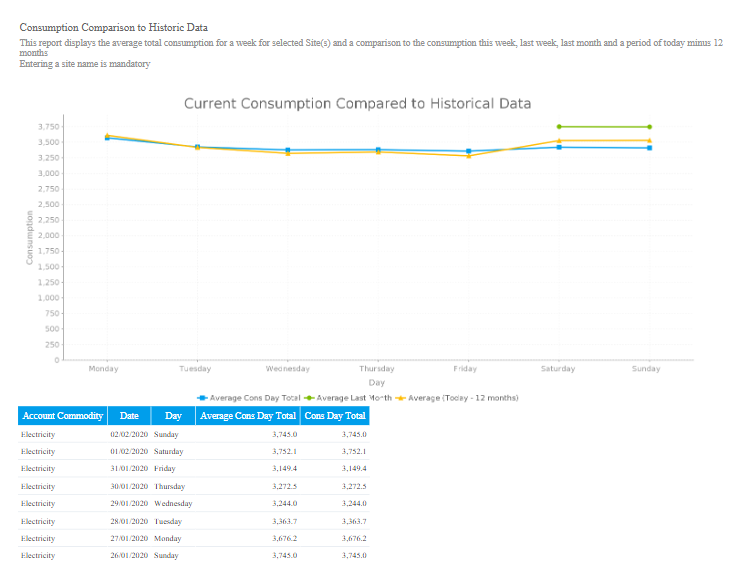
| Consumption Comparison to Historic Data (Best Available Data) |
| Consumption Comparison to Historic Data (Best Available Data)Displays the average total consumption for a week for selected Site(s) and a comparison to the consumption this week, last week, last month and a period of today minus 12 months |
| Daily Emissions Data Audit |
| Daily Emissions Data AuditUsing the Sigma Best Available Consumption View, this report shows the Emissions Factors, the Primary, Secondary CO2 and CO2e Emissions, followed by the CO2 and CO2e totals for a given Supply Point or Consumption Data item for each day. It also shows the source (e.g. Bills) and Type (e.g. Estimated) of data. |
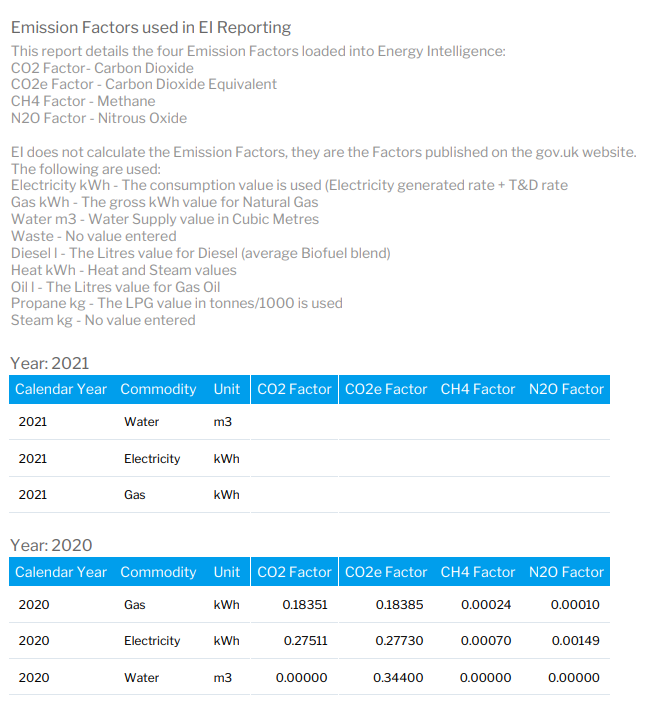
| Emission & Conversion Factors used in EI Reporting |
| Emission & Conversion Factors used in EI ReportingThis report details the four standard Emission Factors loaded into Energy Intelligence: EI does not calculate the Conversion Factors, but uses the values for the Category, Activity and Sub category for the Commodity as published on the gov.uk website. |
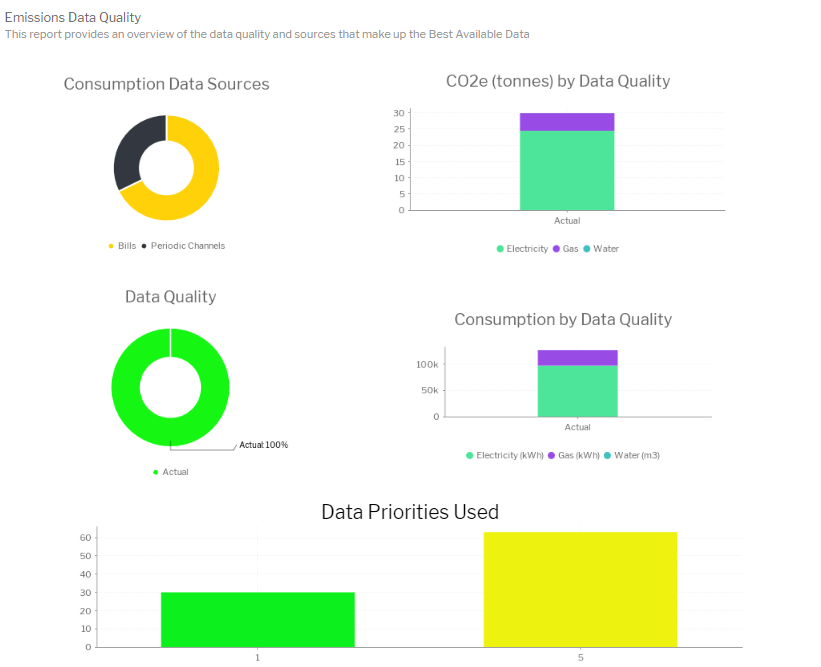
| Emissions Data Quality |
| Emissions Data QualityProvides an overview of the data quality and sources that make up the Best Available Data |
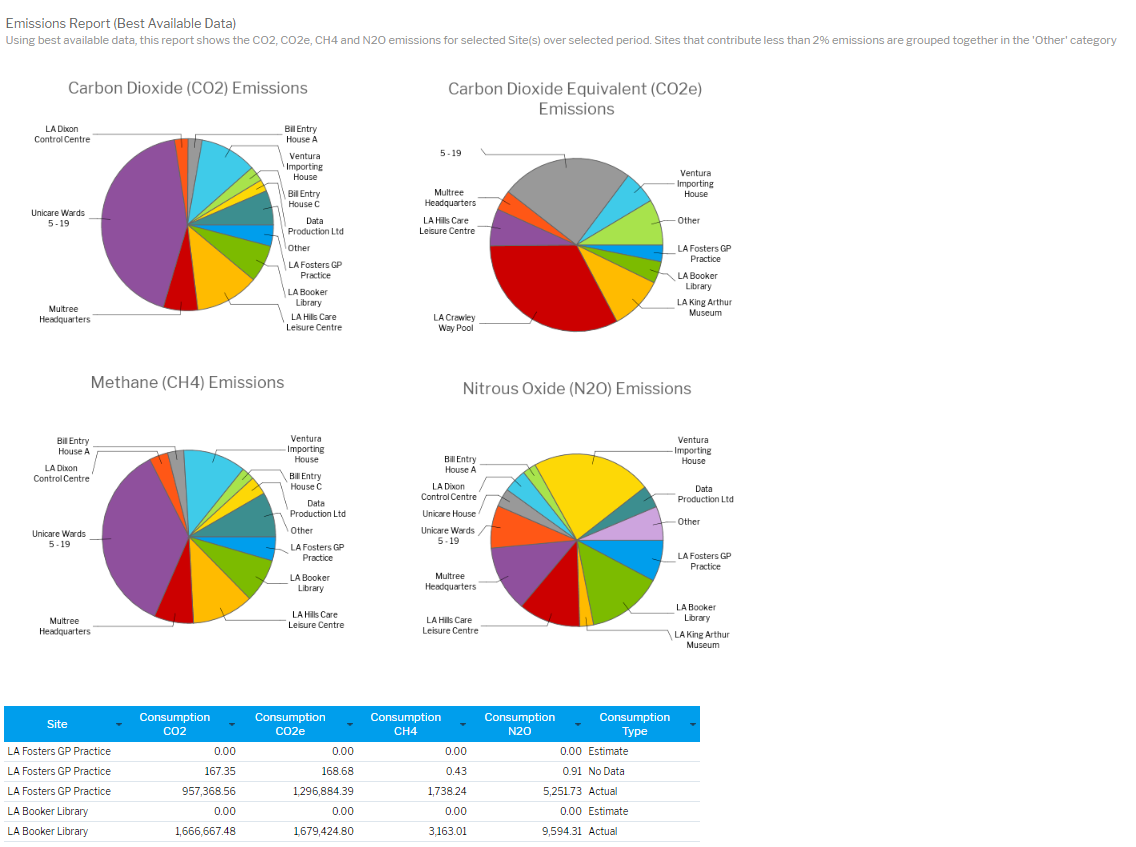
| Emissions Report (Best Available Data) |
| Emissions Report (Best Available Data)Shows the CO2, CO2e, CH4 and N2O emissions for selected Site(s) over selected period. Sites that contribute less than 2% emissions are grouped together in the 'Other' category. |
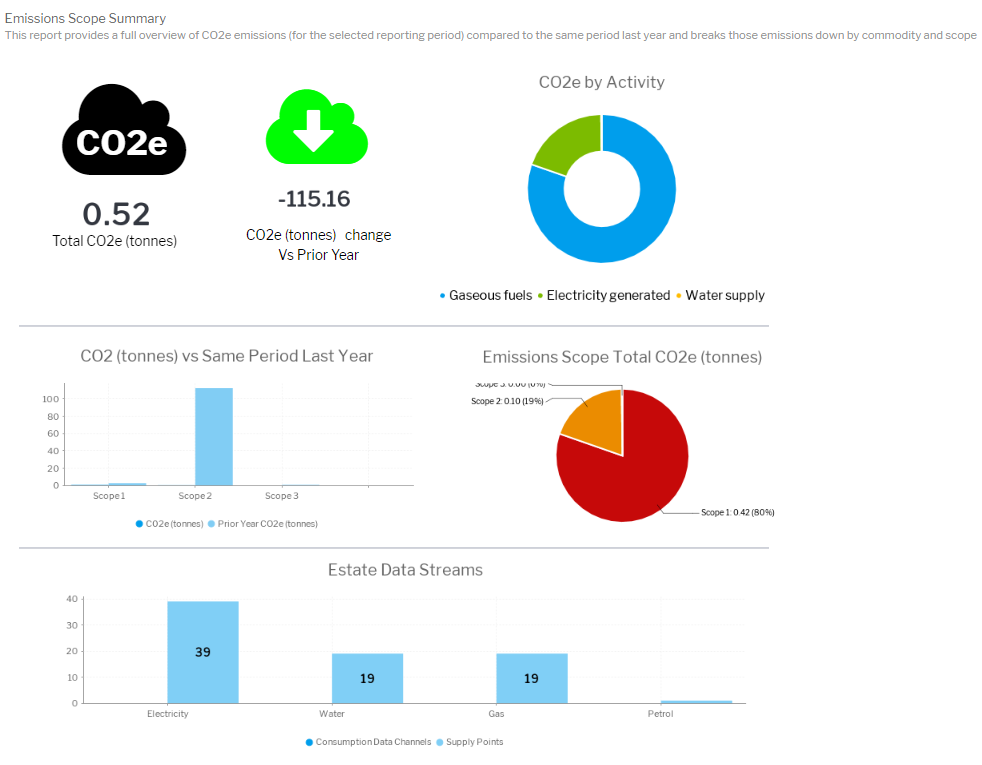
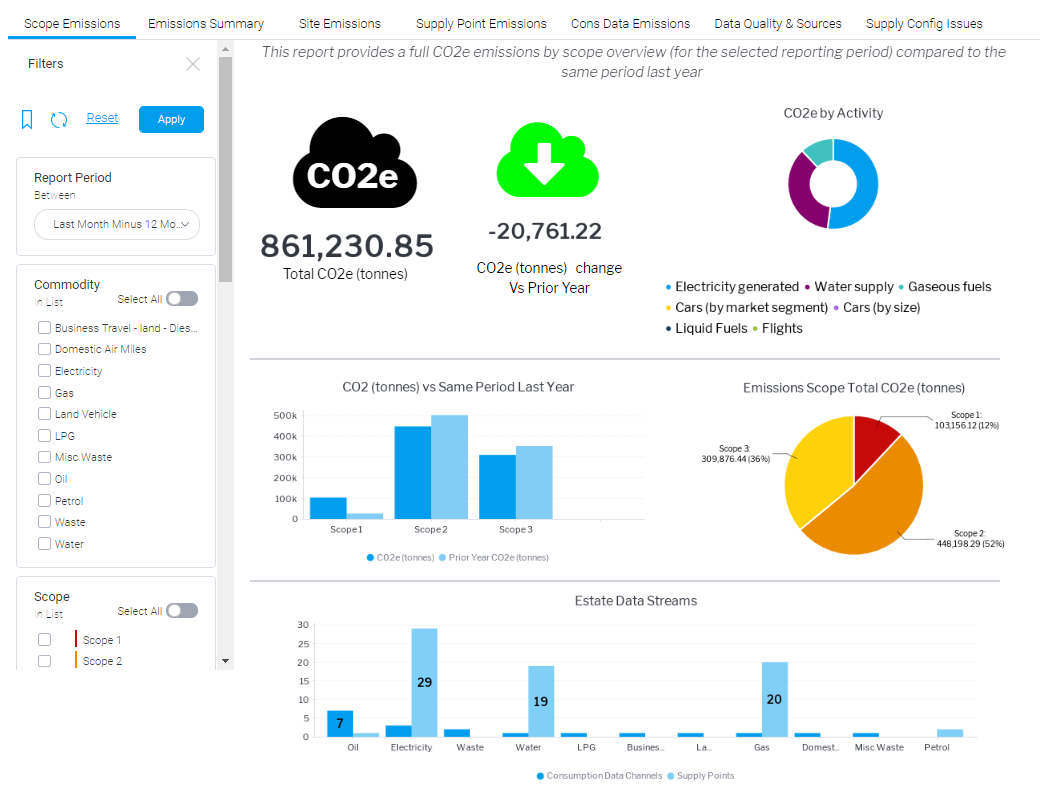
| Emissions Scope Summary |
| Emissions Scope SummaryThis report provides a full overview of CO2e emissions (for the selected reporting period) compared to the same period last year and breaks those emissions down by commodity and scope |
| Emissions Summary |
| Emissions SummaryProvides a full overview of CO2e emissions (for the selected reporting period) compared to the same period last year and breaks those emissions down by commodity |
| Emissions Summary Dashboard |
| Emissions Summary DashboardThe Dashboard consists of 7 tabs and 12 reports
|
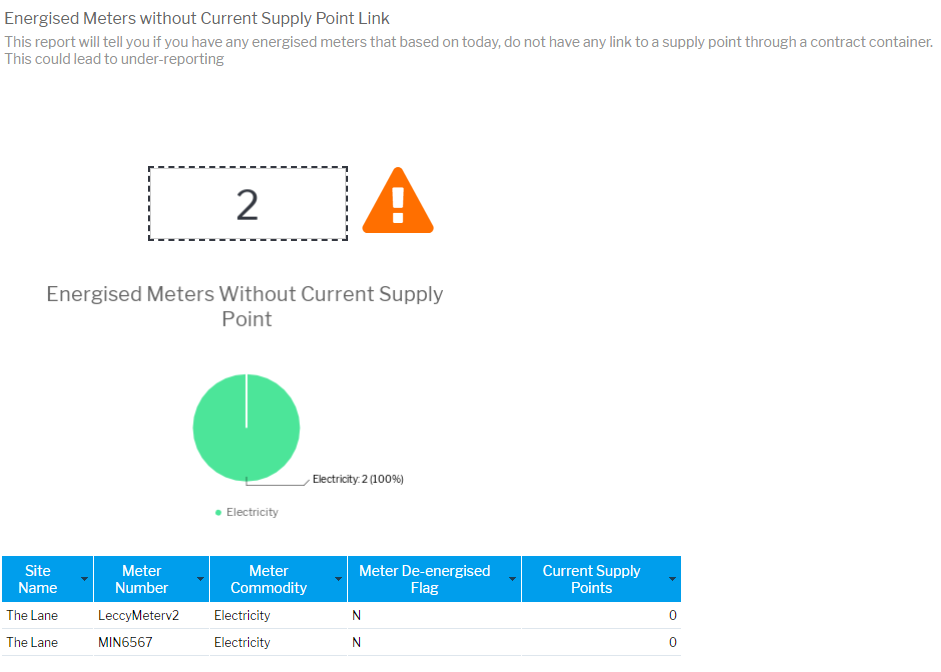
| Energised Meters without Current Supply Point Link |
| Energised Meters without Current Supply Point LinkTells you if you have any energised meters that based on today, do not have any link to a supply point through a contract container. This could lead to under-reporting |
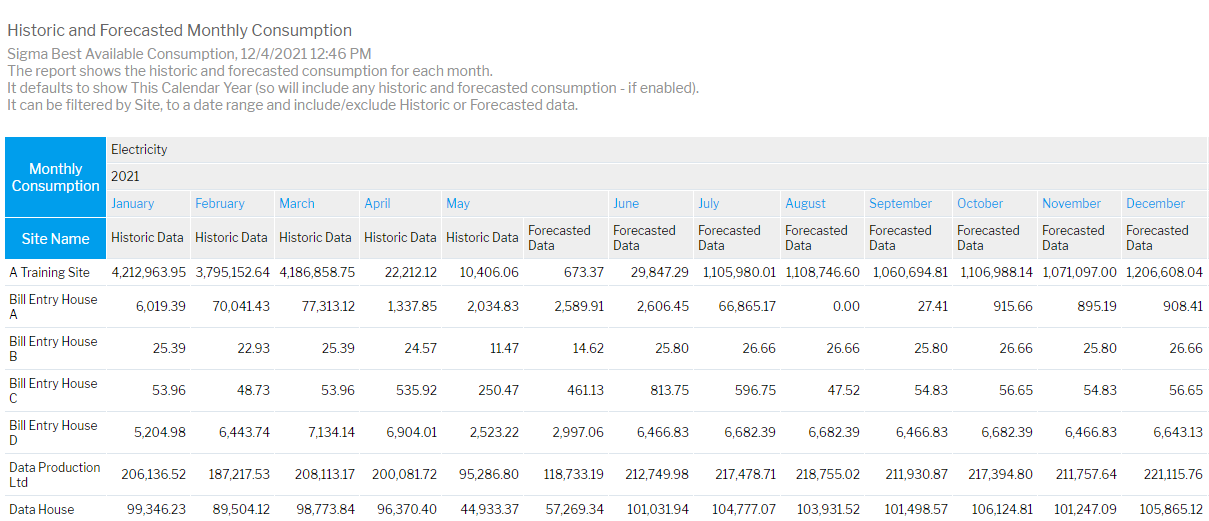
| Historic and Forecasted Consumption |
| Historic and Forecasted Consumption The report shows the historic and forecasted consumption for each month. It defaults to show This Calendar Year (so will include any historic and forecasted consumption - if enabled). It can be filtered by Site, to a date range or commodity and include/exclude Historic or Forecasted data. |
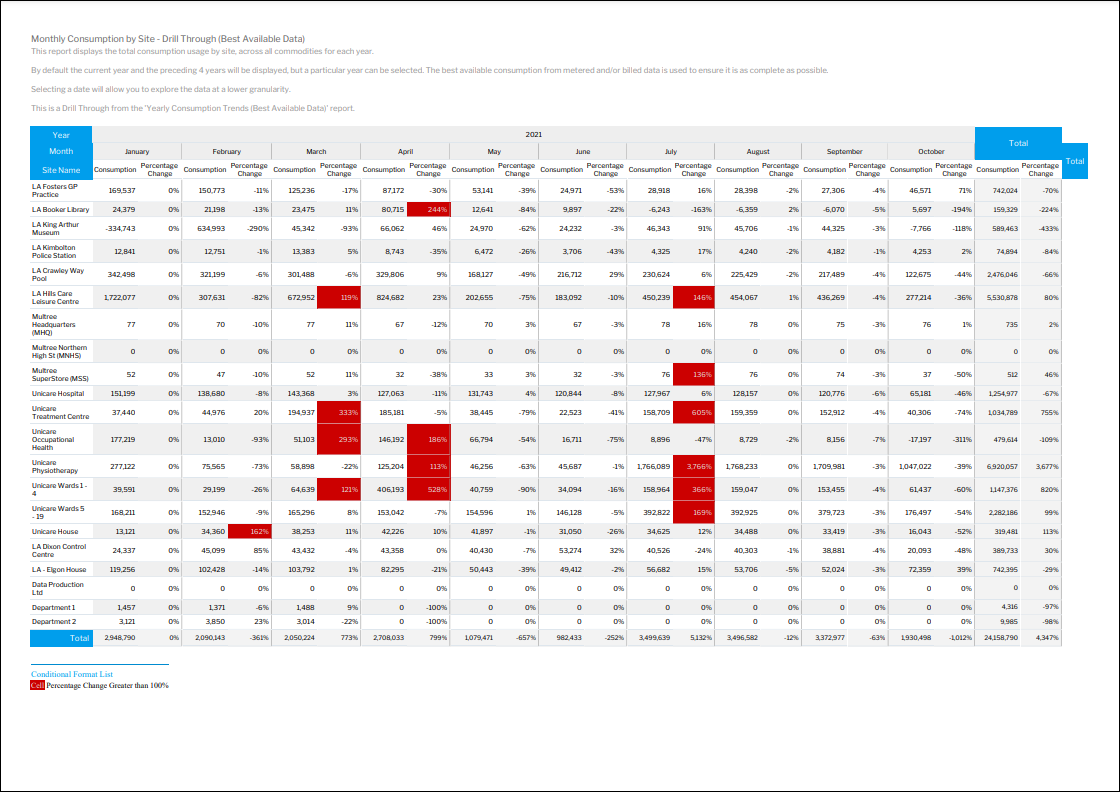
| Monthly Consumption by Site - Drill Through (Best Available Data) |
| Monthly Consumption by Site - Drill Through (Best Available Data)This report displays the total consumption usage by site, across all commodities for each year. By default the current year and the preceding 4 years will be displayed, but a particular year can be selected. The best available consumption from metered and/or billed data is used to ensure it is as complete as possible. Selecting a date will allow you to explore the data at a lower granularity. This is a Drill Through from the 'Yearly Consumption Trends (Best Available Data)' report. |
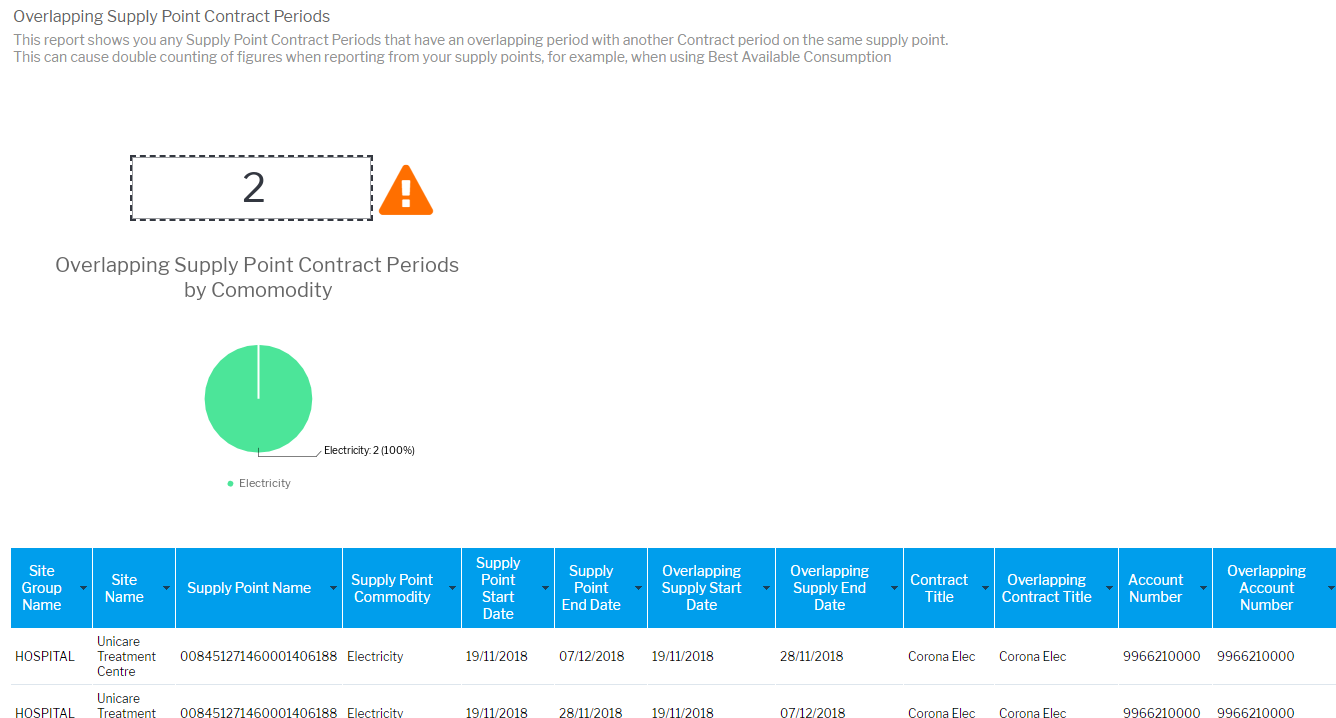
| Overlapping Supply Point Contract Periods |
| Overlapping Supply Point Contract PeriodsShows you any Supply Point Contract Periods that have an overlapping period with another Contract period on the same supply point. This can cause double counting of figures when reporting from your supply points, for example, when using Best Available Consumption |
| Primary, Secondary and Total CO2 and CO2e Emissions (in tonnes) - RETIRED | Primary, Secondary and Total CO2 and CO2e Emissions (in tonnes)This report has been retired and replaced with: Total CO2 and CO2 Emissions by Consumption Source(see below) | |
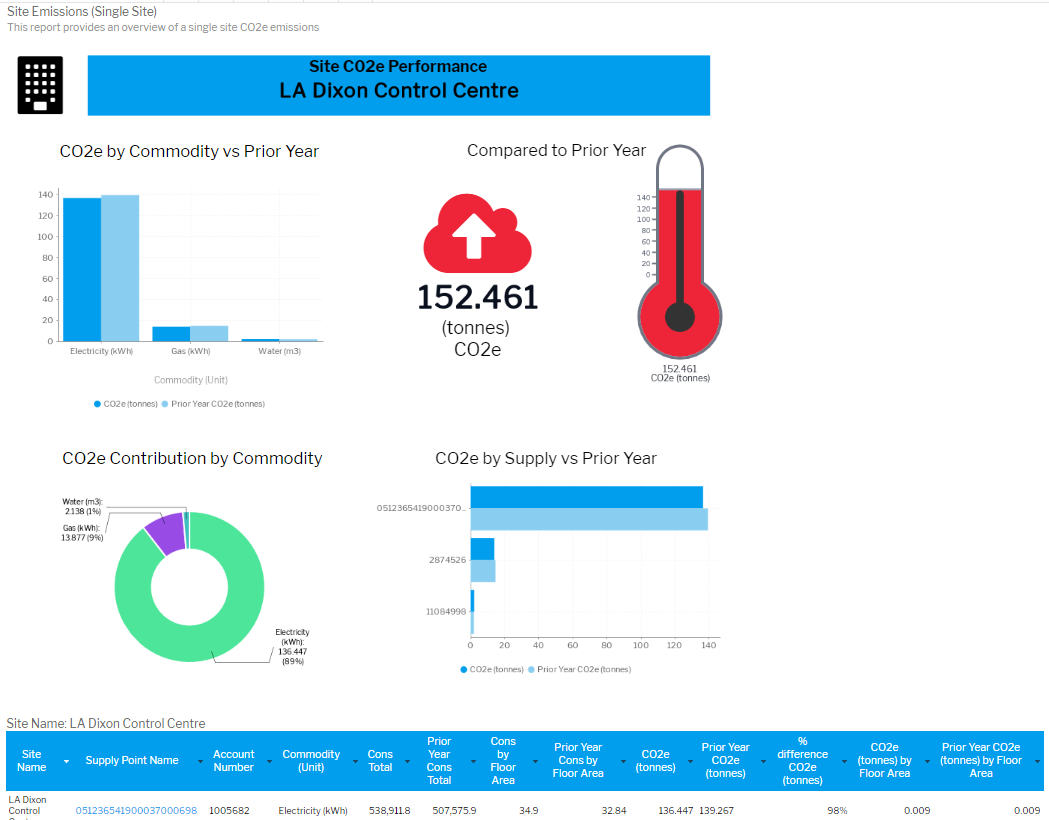
| Site Emissions (Single Site) |
| Site Emissions (Single Site)Provides an overview of a single site CO2e emissions |
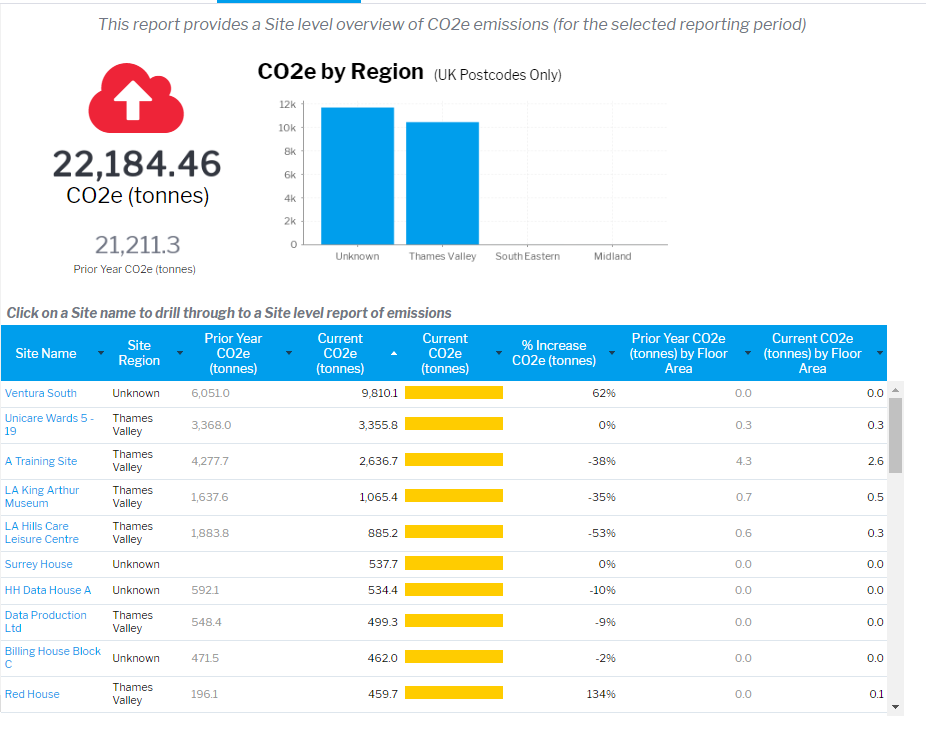
| Site Emissions Overview |
| Site Emissions OverviewProvides a Site level overview of C02 emissions (for the selected reporting period) |
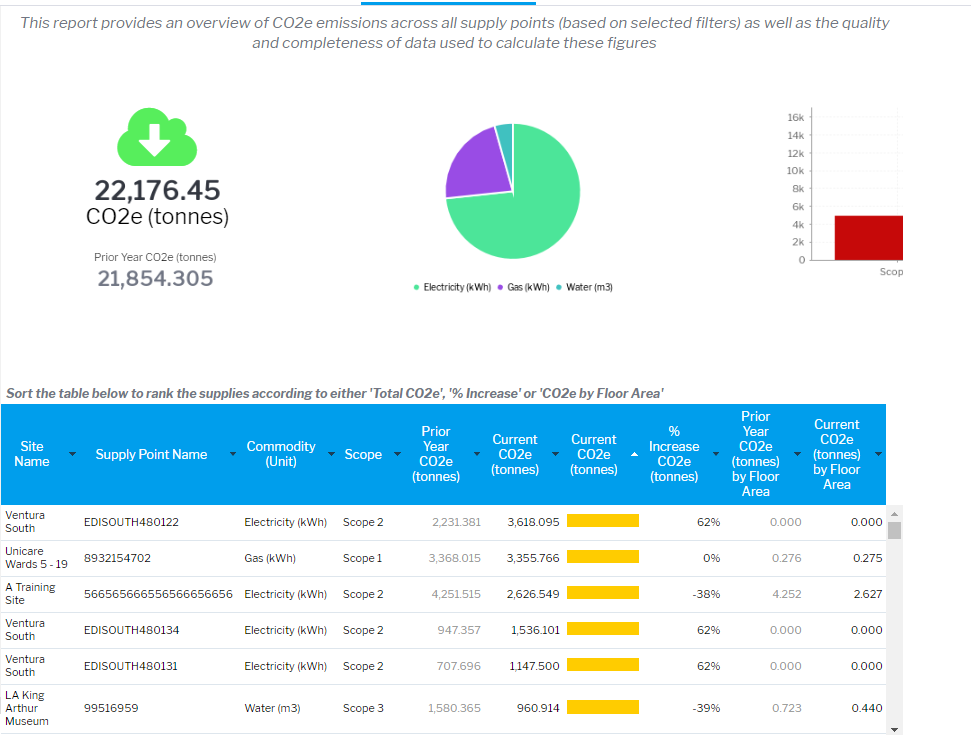
| Supply Emissions Summary |
| Supply Emissions SummaryProvides an overview of the C02e emissions across all supply points (based on selected filters) as well as the quality and completeness of data used to calculate these figures Links to the Supply Points Emissions (Single Supply) Report |
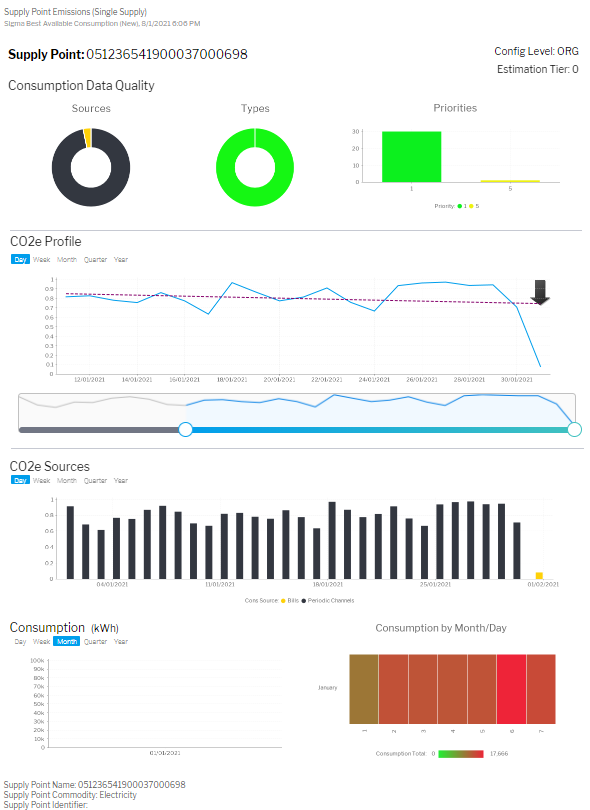
| Supply Point Emissions (Single Supply) |
| Supply Point Emissions (Single Supply)Shows details of a single Supply Point such as the data quality, C02e profile, C02e source and consumption Links from the Supply Points Emission Report |
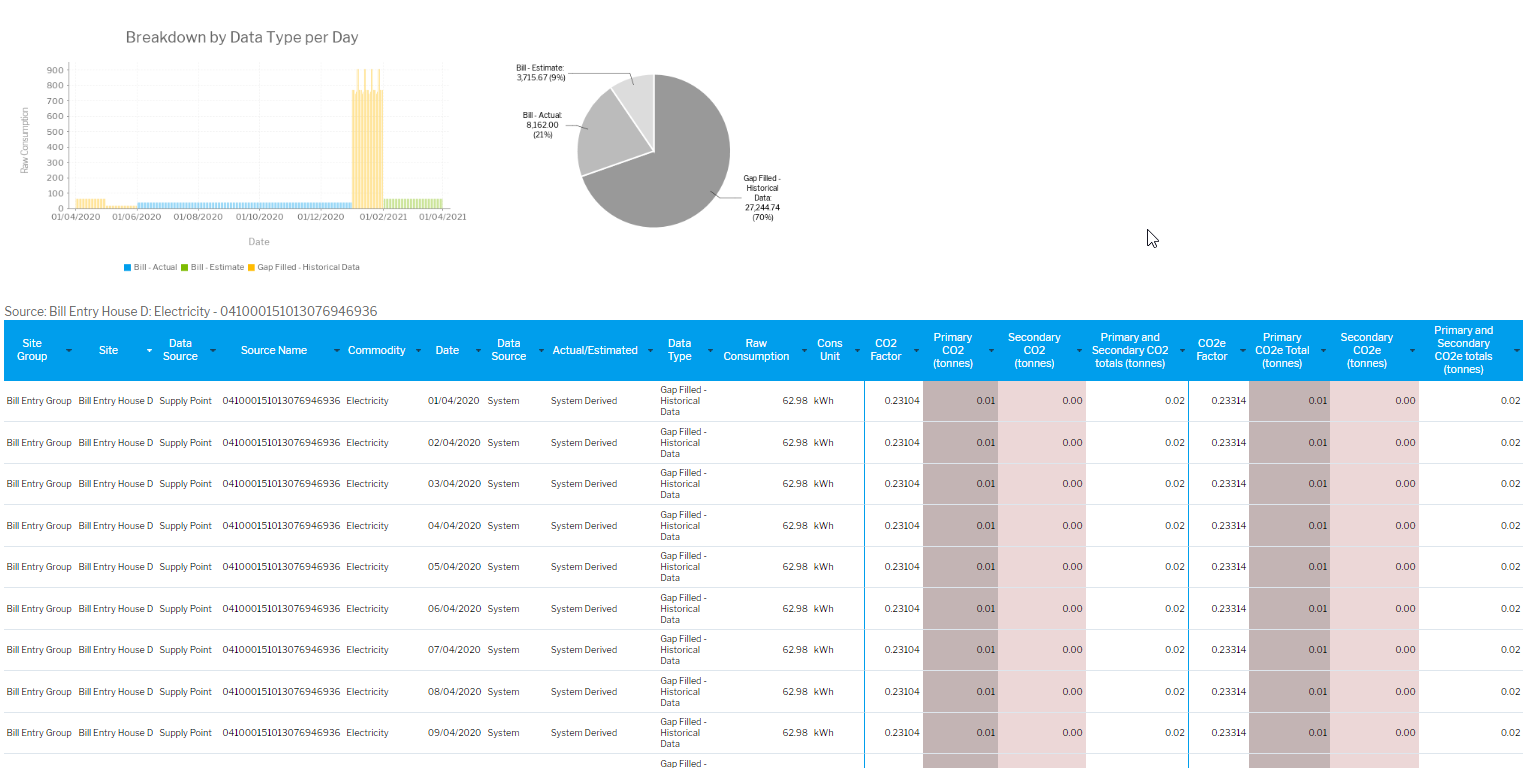
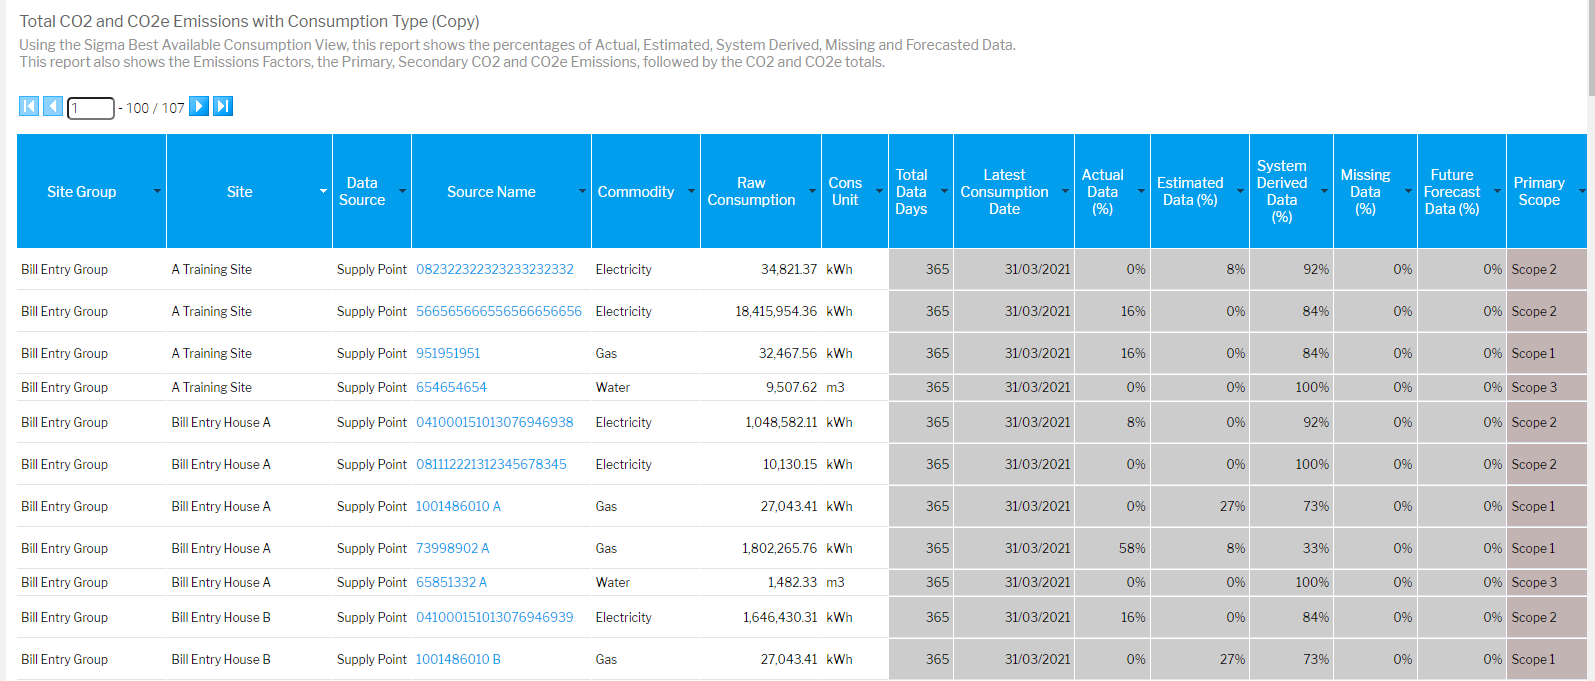
| Total CO2 and CO2 Emissions by Consumption Source |
| Total CO2 and CO2e Emissions by Consumption SourceUsing the Sigma Best Available Consumption View, this report shows the percentages of Actual, Estimated, System Derived, Missing and Forecasted Data. This report also shows the Emissions Factors, the Primary, Secondary CO2 and CO2e Emissions, followed by the CO2 and CO2e totals. This report drills through to the Daily Emissions Data Report |
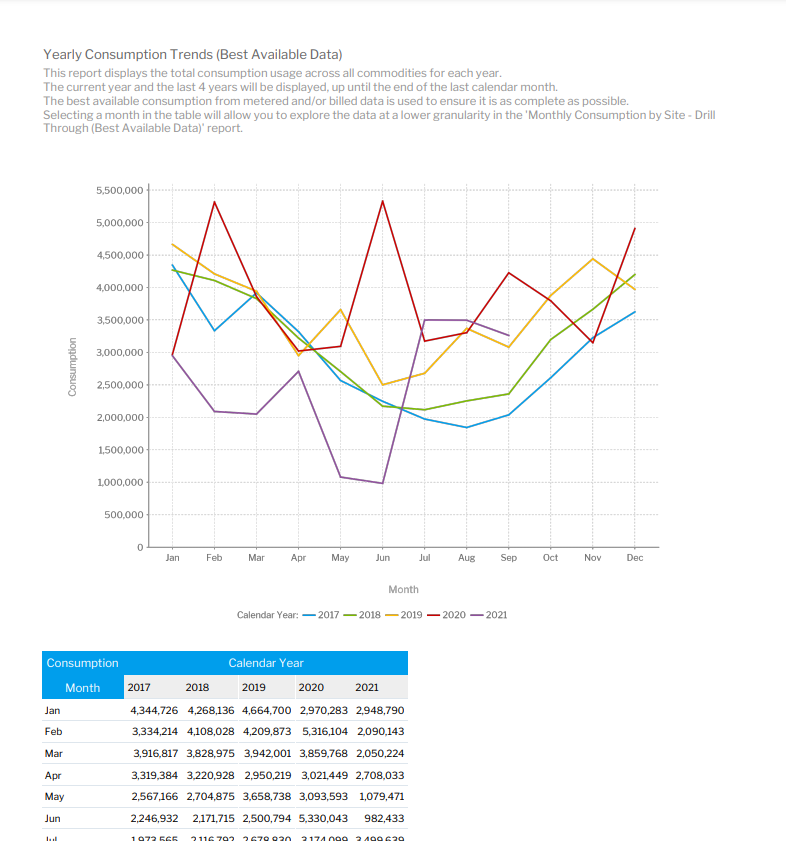
| Yearly Consumption Trends (Best Available Data) |
| Yearly Consumption Trends (Best Available Data)This report displays the total consumption usage across all commodities for each year. The current year and the last 4 years will be displayed, up until the end of the last calendar month. The best available consumption from metered and/or billed data is used to ensure it is as complete as possible. Selecting a month in the table will allow you to explore the data at a lower granularity in the 'Monthly Consumption by Site - Drill Through (Best Available Data)' report. |
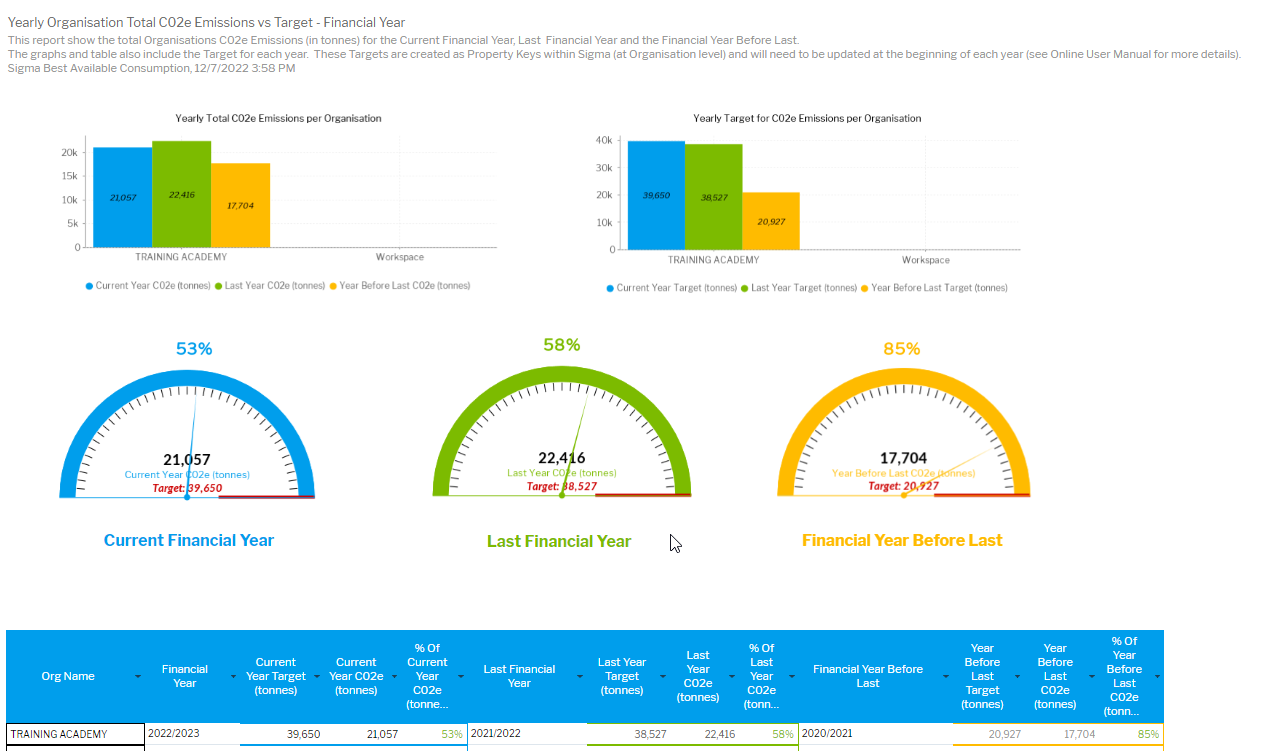
| Yearly Organisation Total C02e Emissions Vs Target - Financial Year |
| Yearly Organisation Total C02e Emissions vs Target - Financial YearThis report shows the total Organisations C02e Emissions (in tonnes) for the Current Financial Year, Last Financial Year and the Financial Year Before Last. The graphs and table also include the Target for each year. These Targets are created as Property Keys within Sigma (at Organisation level) and will need to be updated at the beginning of each year. Click here for more details on how to create and update the Target figures. The Targets are created in Sigma as Property Keys and need to be updated at the beginning of each year. Click here for details on how to update the Property Keys. |
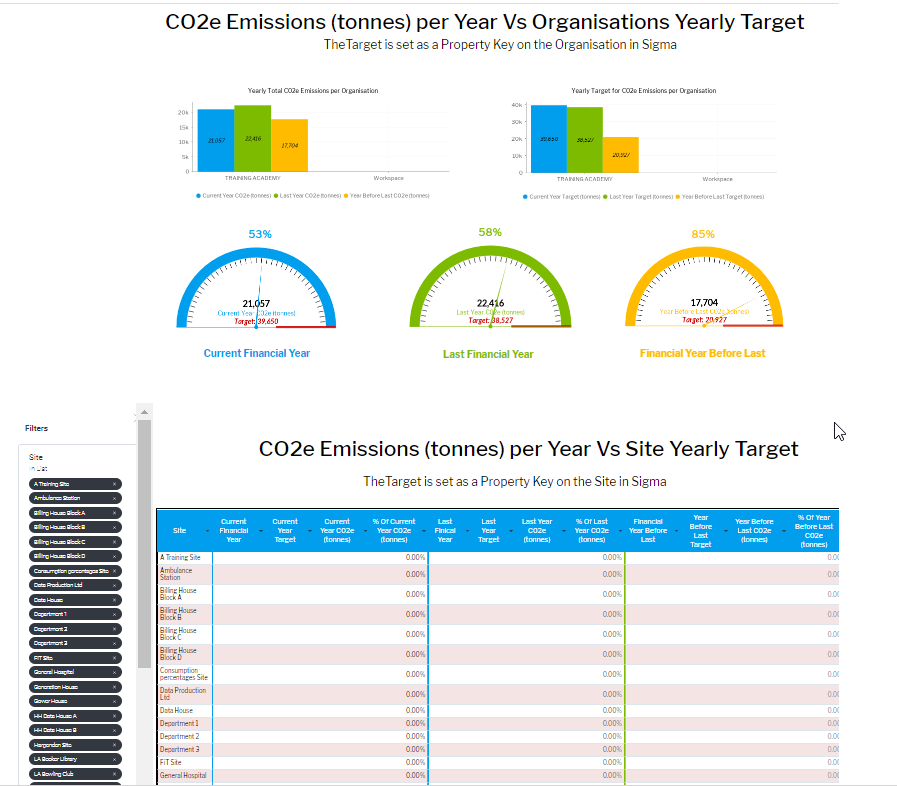
Yearly C02e Emissions vs Target per Organisation and per Site - Financial Year (Dashboard) |
| Yearly C02e Emissions vs Target per Organisation and per Site - Financial YearThis Dashboard combines two reports to show you the Yearly C02e Emissions vs a pre defined Target for the Current Year, Last Year and the Year Before Last. These Targets are created as Property Keys within Sigma (at Organisation and Site level) and will need to be updated at the beginning of each year The Graphs and the top table show data for the whole Organisations and, if Targets have also been set for Sites, the bottom table shows data for each Site. The Targets are created in Sigma as Property Keys and need to be updated at the beginning of each year. Click here for details on how to update the Property Keys. |

@ Copyright TEAM - Energy Auditing Agency Limited Registered Number 1916768 Website: www.teamenergy.com Telephone: +44 (0)1908 690018