Sigma Online User Manual
Example Dashboards in EI
Introduction
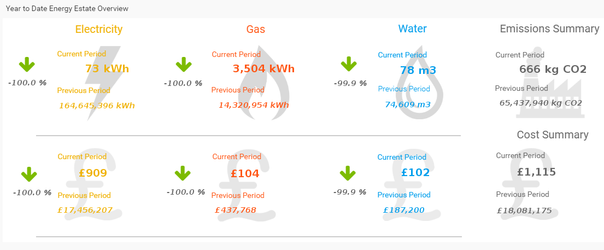
Dashboards are the perfect way to monitor your energy and get answers quickly. Sigma EI dashboards are easy to create and highly customisable. Drive increased user adoption with personalised and interactive dashboards. Keep your energy management on track with strategic dashboards that monitor what’s important. With Sigma EI, you can see all your energy data sources on a single dashboard with high level summary reports and KPIs, then, easily drill into the detail to quickly answer your questions and act fast.
Design
Dashboards are designed to visually display Key Performance Indicators (KPI) in order to allow quick and clear examination of actual performance. A typical dashboard is designed with high level reports that can drill down to more detail when required.
Sigma EI's dashboard allows you to display all key reports on a single page, using tabs to organise by subject and type. The tab feature also allows you to search your public repository for enabled reports and add them to a selected tab, or grant access to pre-built public tabs.
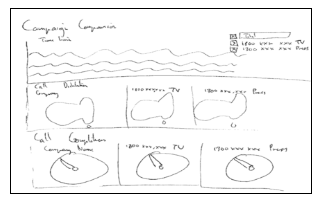
Planning your dashboard is an important process. When designing, think about what means of display will communicate the data best. Think about the number of different charts, tables, and reports you display on a dashboard, the clearer the better. Pictured is an example of a hand drawn design.
Pre-configured Dashboard
Sigma EI has a number of pre-configured Dashboards see the Dashboard Library in the User Manual for details.
@ Copyright TEAM - Energy Auditing Agency Limited Registered Number 1916768 Website: www.teamenergy.com Telephone: +44 (0)1908 690018