...
- Open the Estate Management Activity.
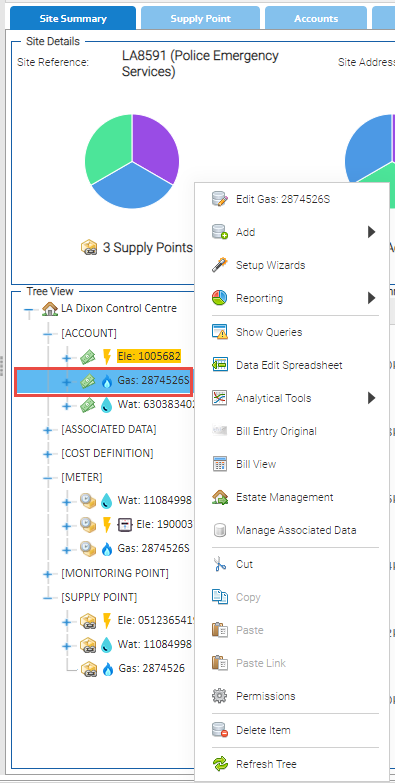
- Highlight a Site in the Data Selector to see the Site Summary Tab.
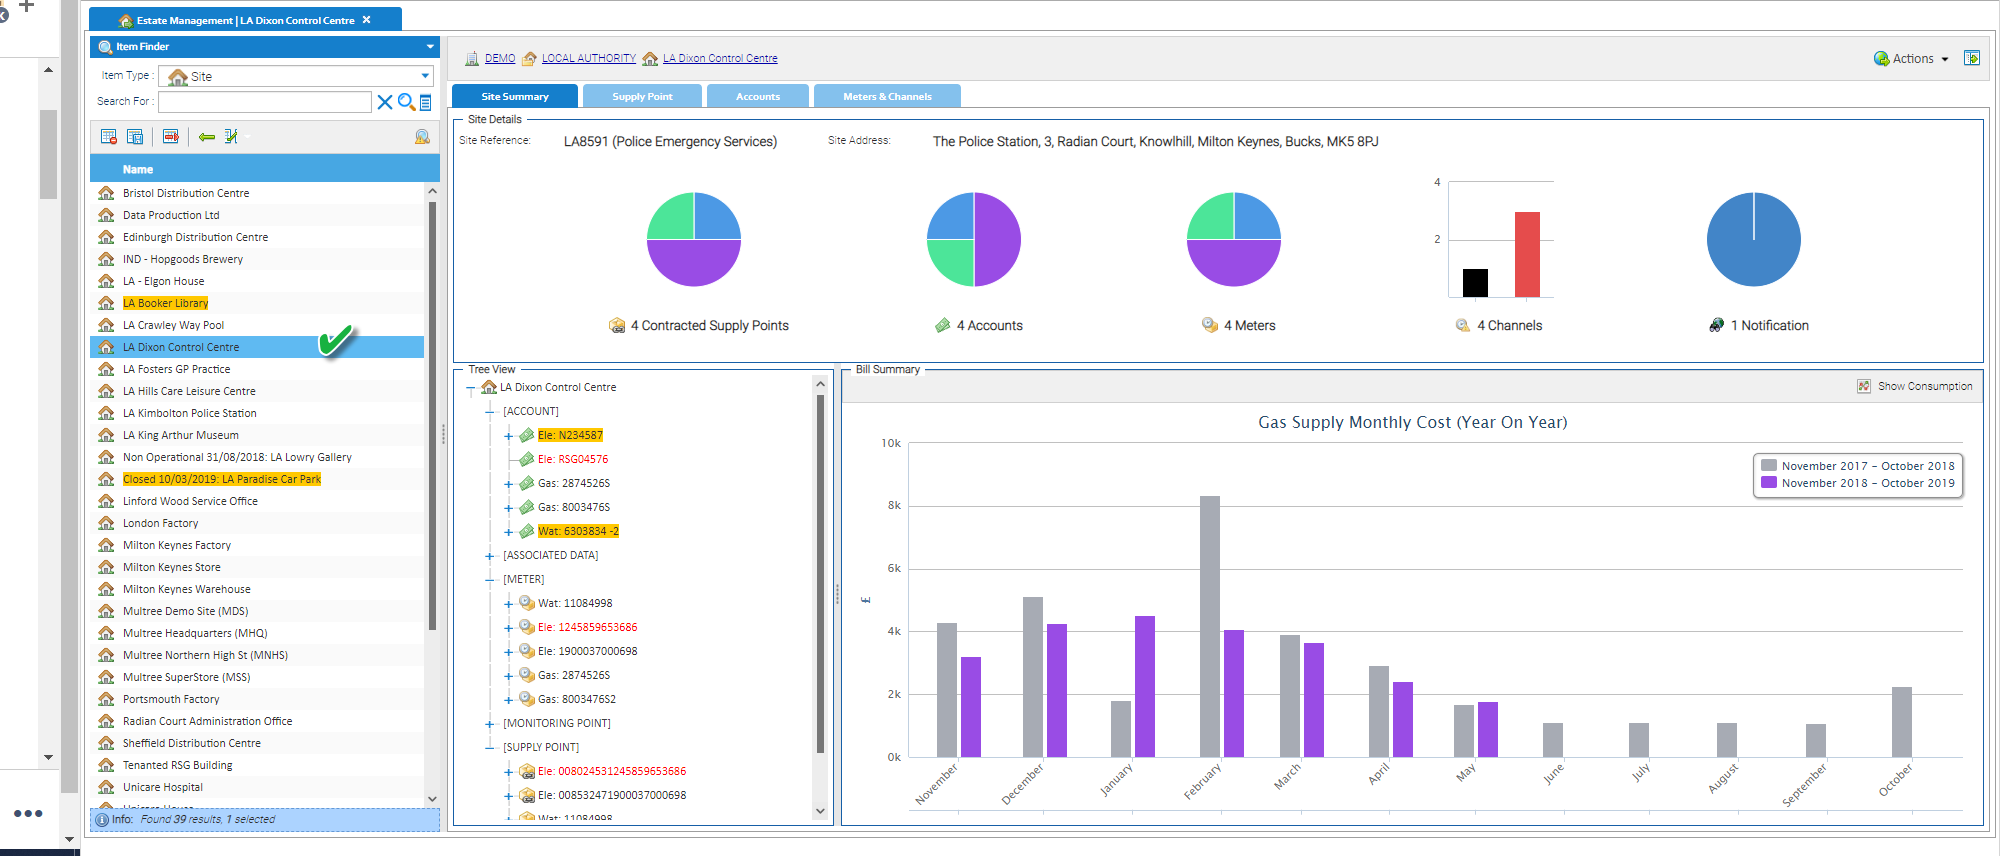
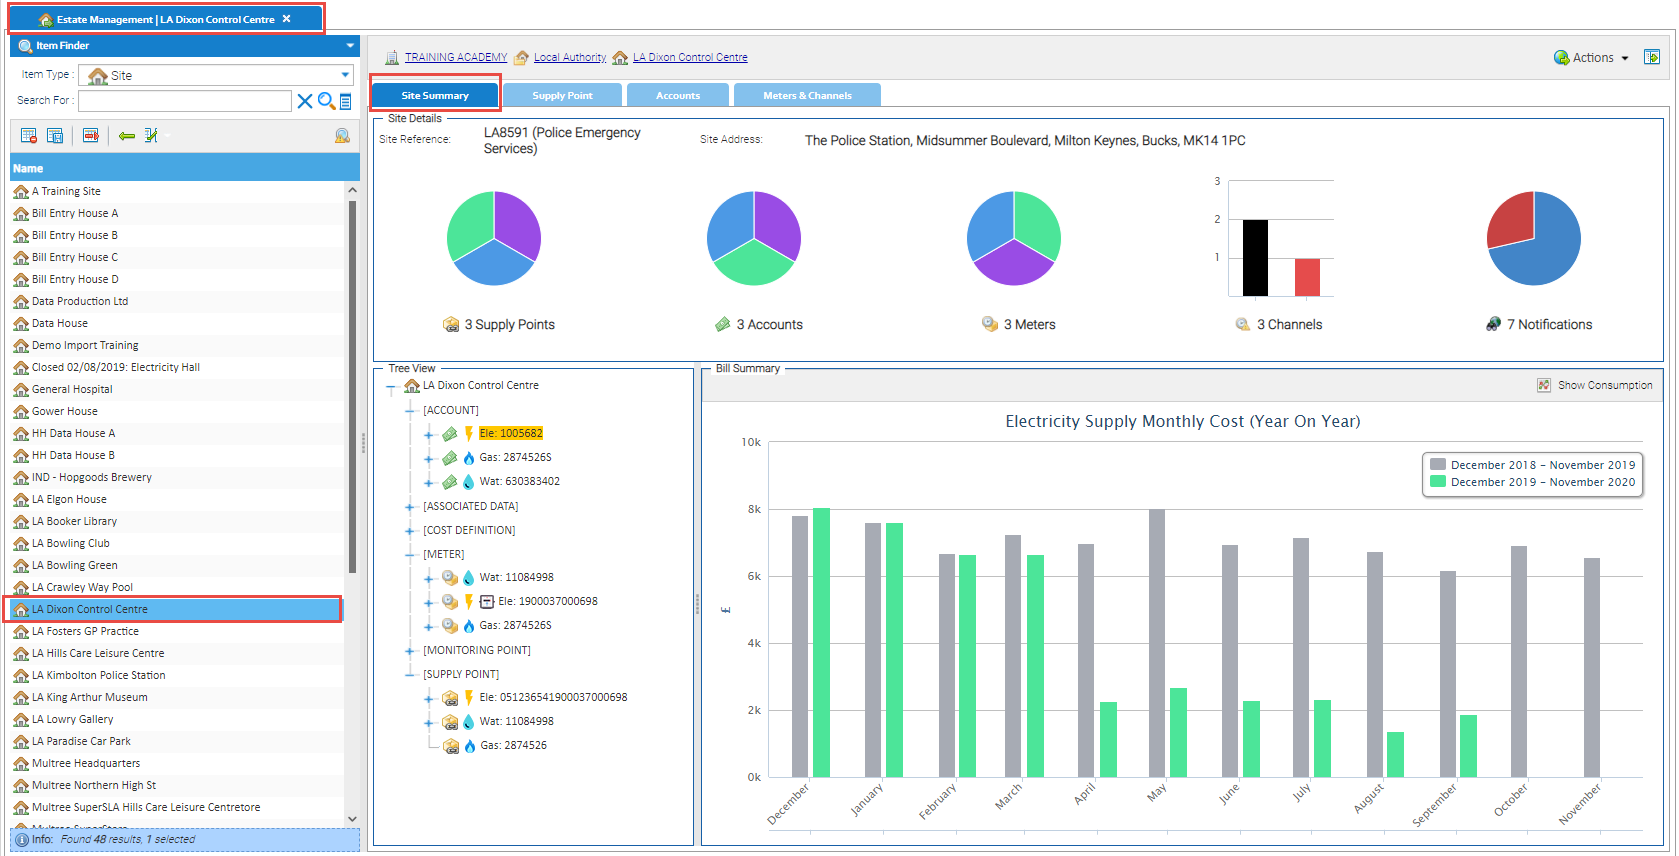
Site Details Section
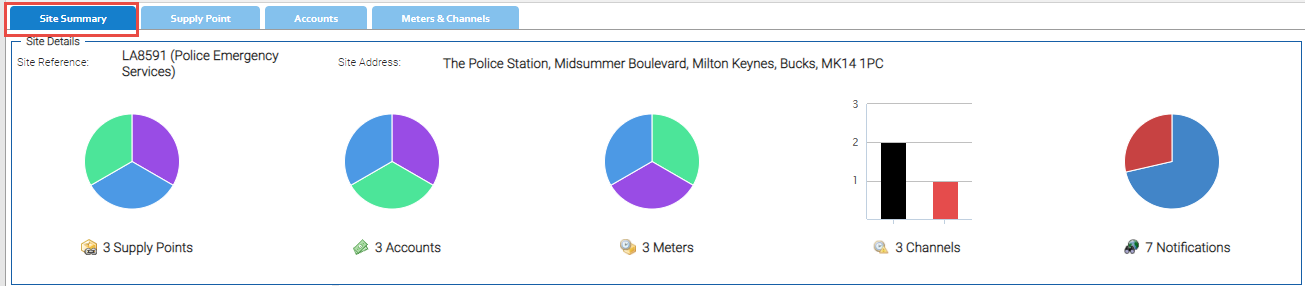
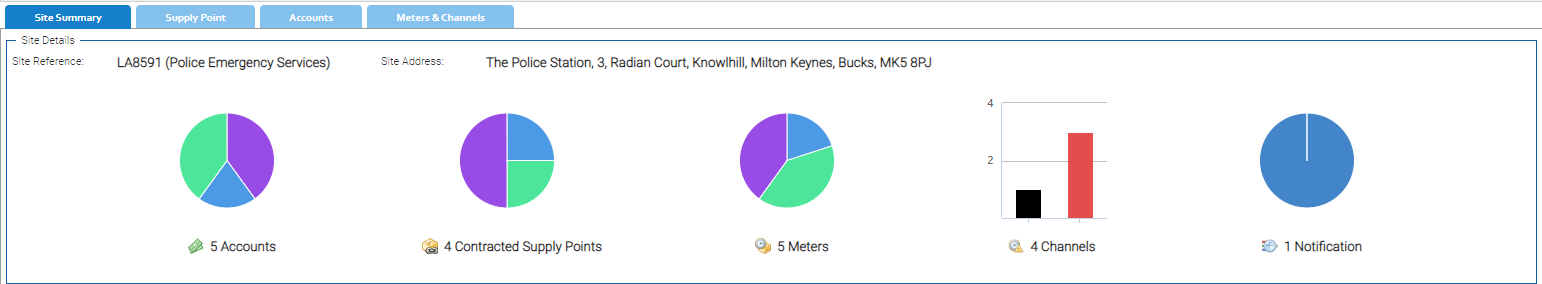
This details :
- The Site Reference
- The Site Address
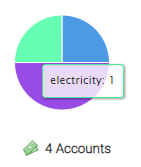
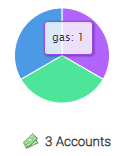
- Three Individual Pie Charts showing:
- Accounts - by commodity
- Supply Points - by commodity
- Meters - by commodity
- A Bar Chart showing the count of any Periodic and Non Periodic Channels
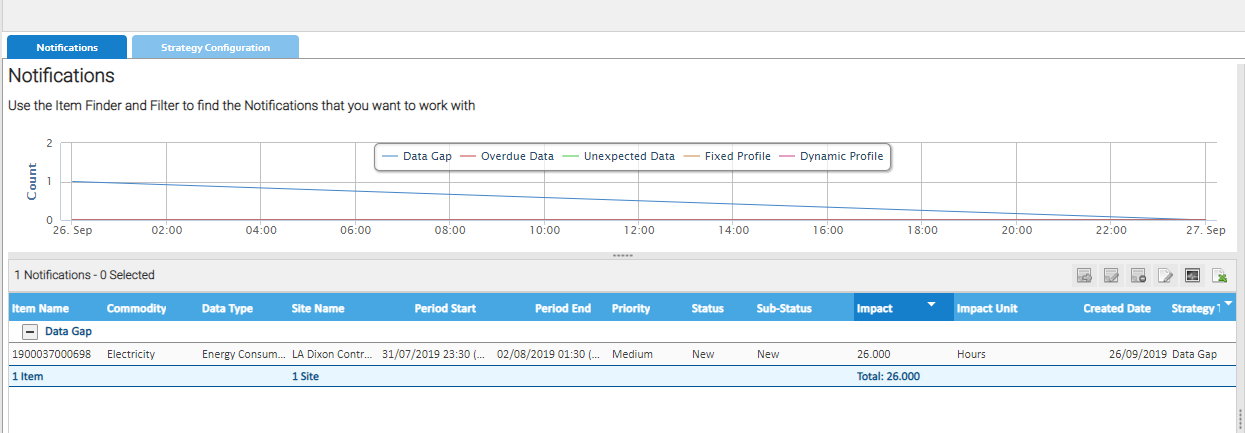
- A Pie Chart of how many Data Monitoring Notifications are outstanding.
| Note |
|---|
The colours used in the screen represent the different commodities.
Hovering over a Pie Chart/Graph will show the applicable number of Accounts for the Commodity: |
| Tip |
|---|
To move to any other Tab, either click on the applicable Chart (e.g. clocking the Meters Pie Chart will open the "Meters and Channels" tab) or click on the Tab above the Site Details box. Clicking on the Notification Pie Chart will open the Data Monitoring Activity. The Data Monitoring Activity will default to show the outstanding notifications for the selected Site |
...
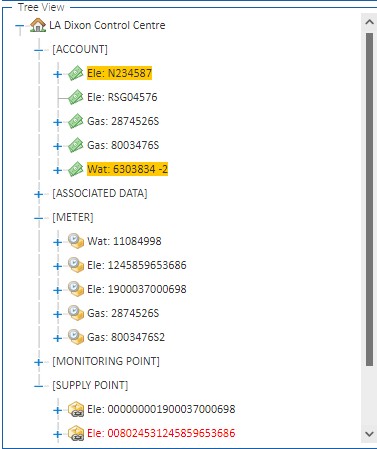
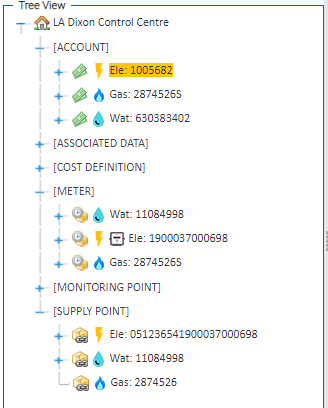
The other Items on the Site will be visible, but will not be expanded by default.
| Tip |
|---|
|
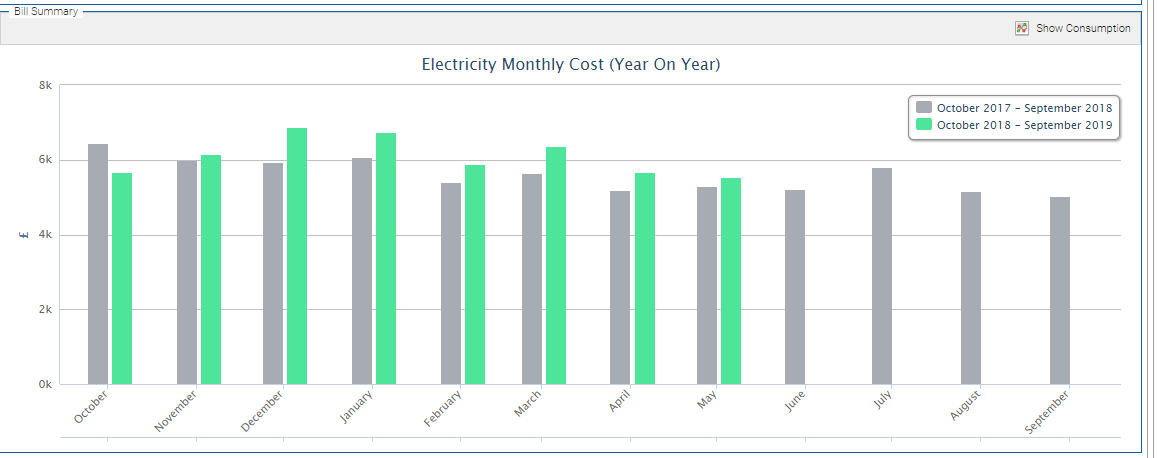
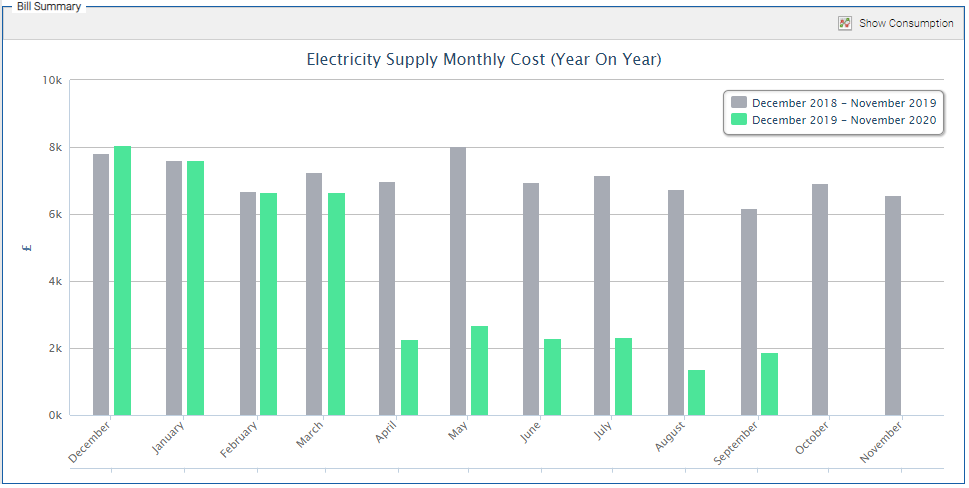
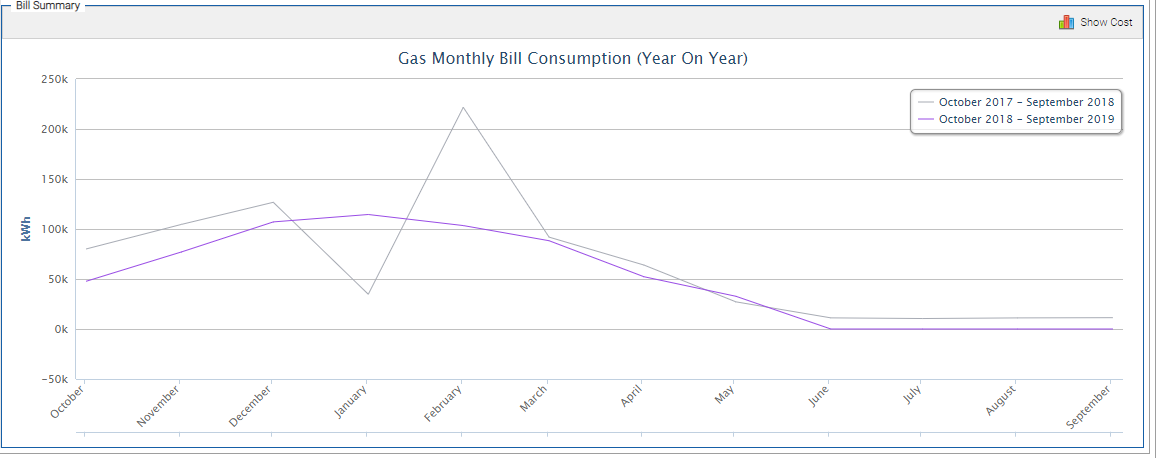
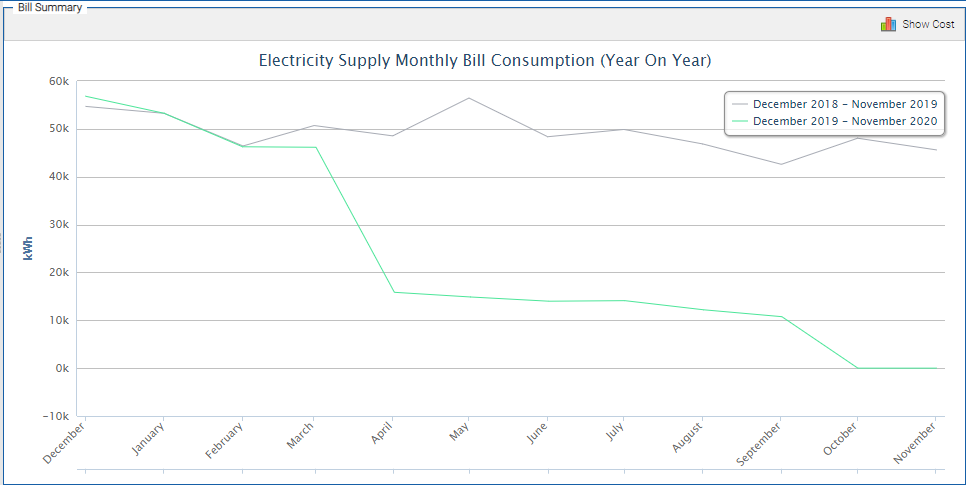
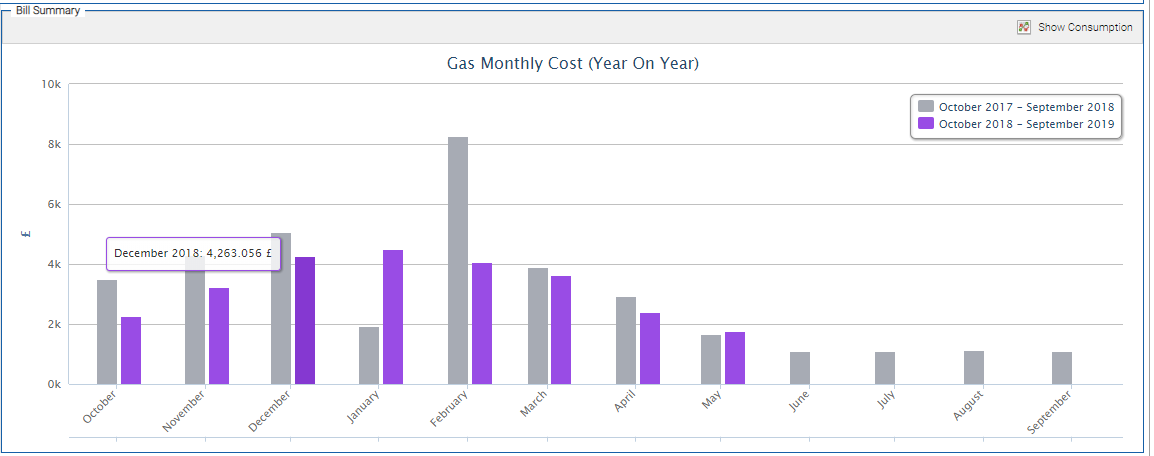
Bill Summary Section
...
Cost Example (Bar)
Consumption Example (Line)
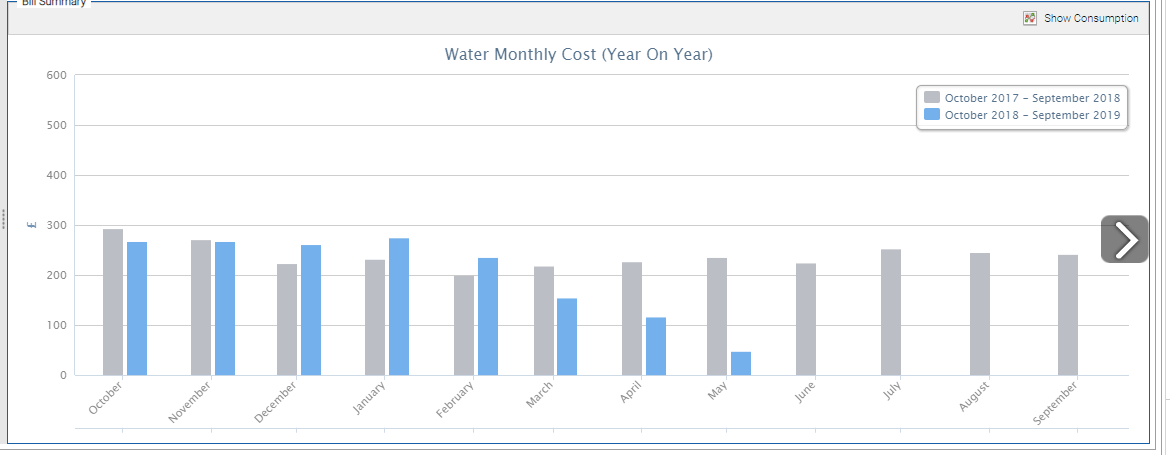
| Tip |
|---|
To manually scroll through each of the Commodities for which Bills exist, hover over the right hand side of the chart and an arrow will appear:
|
...